Metro PCS 2007 Annual Report Download - page 80
Download and view the complete annual report
Please find page 80 of the 2007 Metro PCS annual report below. You can navigate through the pages in the report by either clicking on the pages listed below, or by using the keyword search tool below to find specific information within the annual report.-
 1
1 -
2
-
3
-
4
-
5
-
6
-
7
-
8
-
9
-
10
-
11
-
12
-
13
-
14
-
15
-
16
-
17
-
18
-
19
-
20
-
21
-
22
-
23
-
24
-
25
-
26
-
27
-
28
-
29
-
30
-
31
-
32
-
33
-
34
-
35
-
36
-
37
-
38
-
39
-
40
-
41
-
42
-
43
-
44
-
45
-
46
-
47
-
48
-
49
-
50
-
51
-
52
-
53
-
54
-
55
-
56
-
57
-
58
-
59
-
60
-
61
-
62
-
63
-
64
-
65
-
66
-
67
-
68
-
69
-
 70
70 -
 71
71 -
 72
72 -
 73
73 -
 74
74 -
 75
75 -
 76
76 -
 77
77 -
 78
78 -
 79
79 -
 80
80 -
 81
81 -
 82
82 -
 83
83 -
 84
84 -
 85
85 -
 86
86 -
 87
87 -
 88
88 -
 89
89 -
 90
90 -
91
-
92
-
93
-
94
-
95
-
96
-
97
-
98
-
99
-
100
-
101
-
102
-
103
-
104
-
105
-
106
-
107
-
108
-
109
-
110
-
111
-
112
-
113
-
114
-
115
-
116
-
117
-
118
-
119
-
120
-
121
-
122
-
123
-
124
-
125
-
126
-
127
-
128
-
129
-
130
-
131
-
132
-
133
-
134
-
135
-
136
-
137
-
138
-
139
-
140
-
141
-
142
-
143
-
144
-
145
-
146
-
147
-
148
-
149
-
150
-
151
-
152
-
153
-
154
-
155
-
156
-
157
-
158
-
159
-
160
 |
 |

69
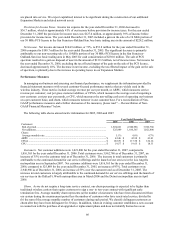
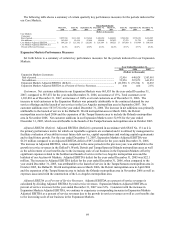
The following table shows a summary of certain quarterly key performance measures for the periods indicated for
our Core Markets.
Three Months Ended
March 31,
2006
June 30,
2006
September 30,
2006
December 31,
2006
March 31,
2007
June 30,
2007
September 30,
2007
December 31,
2007
(Dollars in thousands)
Core Markets
Customers:
End of period ...............................................
.
2,055,550 2,119,168 2,174,264 2,300,958 2,484,811 2,542,290 2,578,019 2,658,905
Net additions................................................
.
183,884 63,618 55,096 126,694 183,853 57,479 35,729 80,886
Core Markets Adjusted EBITDA.................
.
$ 109,120 $ 127,182 $ 128,283 $ 128,188 $ 150,321 $ 167,869 $ 170,984 $ 164,938
Core Markets Adjusted EBITDA as a
Percent of Service Revenues ......................
.
41.2% 45.2% 45.0% 41.8% 44.6% 47.1% 47.7% 45.4%
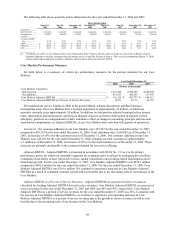
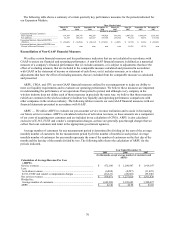
Expansion Markets Performance Measures
Set forth below is a summary of certain key performance measures for the periods indicated for our Expansion
Markets:
Year Ended December 31,
2005 2006 2007
(Dollars in thousands)
Expansion Markets Customers:
End of period ......................................................................................................................
.
52,956 640,028 1,303,881
Net additions.......................................................................................................................
.
52,956 587,072 663,853
Expansion Markets Adjusted EBITDA (Deficit) .................................................................
.
$ (22,090) $ (97,214) $ 12,883
Expansion Markets Adjusted EBITDA as a Percent of Service Revenues ..........................
.
n/m n/m 2.6%
Customers. Net customer additions in our Expansion Markets were 663,853 for the year ended December 31,
2007, compared to 587,072 for the year ended December 31, 2006, an increase of 13%. Total customers were
1,303,881 as of December 31, 2007, an increase of 104% over total customers as of December 31, 2006. The
increase in total customers in the Expansion Markets was primarily attributable to the continued demand for our
service offerings and the launch of our services in the Los Angeles metropolitan area in September 2007. Net
customer additions were 587,072 for the year ended December 31, 2006. The increase in net additions was primarily
attributable to the launch of service in the Dallas/Ft. Worth metropolitan area in March 2006, the Detroit
metropolitan area in April 2006 and the expansion of the Tampa/Sarasota area to include the Orlando metropolitan
area in November 2006. Net customer additions in our Expansion Markets were 52,956 for the year ended
December 31, 2005, which was attributable to the launch of the Tampa/Sarasota metropolitan area in October 2005.
Adjusted EBITDA (Deficit). Adjusted EBITDA (Deficit) is presented in accordance with SFAS No. 131 as it is
the primary performance metric for which our reportable segments are evaluated and it is utilized by management to
facilitate evaluation of our ability to meet future debt service, capital expenditures and working capital requirements
and to fund future growth. For the year ended December 31, 2007, Expansion Markets Adjusted EBITDA was
$12.9 million compared to an Adjusted EBITDA deficit of $97.2 million for the year ended December 31, 2006.
The increase in Adjusted EBITDA, when compared to the same periods in the previous year, was attributable to the
growth in service revenues in the Dallas/Ft. Worth, Detroit and Tampa/Sarasota/Orlando metropolitan areas as well
as the achievement of cost benefits due to the increasing scale of our business in the Expansion Markets offset by
significant expenses related to the buildout and launch of service in the Los Angeles metropolitan area and the
buildout of our Auction 66 Markets. Adjusted EBITDA deficit for the year ended December 31, 2005 was $22.1
million. The increase in Adjusted EBITDA deficit for the year ended December 31, 2006, when compared to the
year ended December 31, 2005, was attributable to the launch of service in the Tampa/Sarasota metropolitan area in
October 2005, the Dallas/Ft. Worth metropolitan area in March 2006, the Detroit metropolitan area in April 2006
and the expansion of the Tampa/Sarasota area to include the Orlando metropolitan area in November 2006 as well as
expenses associated with the construction of the Los Angeles metropolitan area.
Adjusted EBITDA as a Percent of Service Revenues. Adjusted EBITDA as a percent of service revenues is
calculated by dividing Adjusted EBITDA by total service revenues. Expansion Markets Adjusted EBITDA as
percent of service revenues for the year ended December 31, 2007 was 2.6%. Consistent with the increase in
Expansion Markets Adjusted EBITDA, we continue to experience corresponding increases in Expansion Markets
Adjusted EBITDA as a percent of service revenues due to the growth in service revenues as well as cost benefits due
to the increasing scale of our business in the Expansion Markets.