Metro PCS 2007 Annual Report Download - page 57
Download and view the complete annual report
Please find page 57 of the 2007 Metro PCS annual report below. You can navigate through the pages in the report by either clicking on the pages listed below, or by using the keyword search tool below to find specific information within the annual report.-
 1
1 -
2
-
3
-
4
-
5
-
6
-
7
-
8
-
9
-
10
-
11
-
12
-
13
-
14
-
15
-
16
-
17
-
18
-
19
-
20
-
21
-
22
-
23
-
24
-
25
-
26
-
27
-
28
-
29
-
30
-
31
-
32
-
33
-
34
-
35
-
36
-
37
-
38
-
39
-
40
-
41
-
42
-
43
-
44
-
45
-
46
-
 47
47 -
 48
48 -
 49
49 -
 50
50 -
 51
51 -
 52
52 -
 53
53 -
 54
54 -
 55
55 -
 56
56 -
 57
57 -
 58
58 -
 59
59 -
 60
60 -
 61
61 -
 62
62 -
 63
63 -
 64
64 -
 65
65 -
 66
66 -
 67
67 -
68
-
69
-
70
-
71
-
72
-
73
-
74
-
75
-
76
-
77
-
78
-
79
-
80
-
81
-
82
-
83
-
84
-
85
-
86
-
87
-
88
-
89
-
90
-
91
-
92
-
93
-
94
-
95
-
96
-
97
-
98
-
99
-
100
-
101
-
102
-
103
-
104
-
105
-
106
-
107
-
108
-
109
-
110
-
111
-
112
-
113
-
114
-
115
-
116
-
117
-
118
-
119
-
120
-
121
-
122
-
123
-
124
-
125
-
126
-
127
-
128
-
129
-
130
-
131
-
132
-
133
-
134
-
135
-
136
-
137
-
138
-
139
-
140
-
141
-
142
-
143
-
144
-
145
-
146
-
147
-
148
-
149
-
150
-
151
-
152
-
153
-
154
-
155
-
156
-
157
-
158
-
159
-
160
 |
 |

46
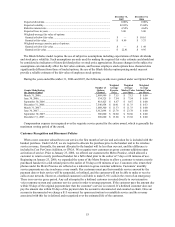
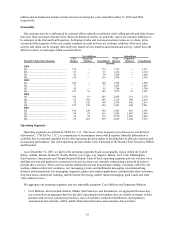
Item 6. Selected Financial Data
The following tables set forth selected consolidated financial data. We derived our selected consolidated financial
data as of and for the years ended December 31, 2007, 2006, 2005 and 2004 from our consolidated financial
statements, which were audited by Deloitte & Touche LLP. We derived our selected consolidated financial data as
of and for the year ended December 31, 2003 from our consolidated financial statements. The historical selected
financial data may not be indicative of future performance and should be read in conjunction with “Management’ s
Discussion and Analysis of Financial Condition and Results of Operations” and “Risk Factors” in this report.
Year Ended December 31,
2003 2004 2005 2006 2007
(In Thousands, Except Share and Per Share Data)
Statement of Operations Data:
Revenues:
Service revenues................................................................................................... $ 369,851 $ 616,401 $ 872,100 $ 1,290,947 $ 1,919,197
Equipment revenues ............................................................................................. 81,258 131,849 166,328 255,916 316,537
Total revenues ..................................................................................................... 451,109 748,250 1,038,428 1,546,863 2,235,734
Operating expenses:
Cost of service (excluding depreciation and amortization disclosed separately
below) ................................................................................................................ 122,211 200,806 283,212 445,281 647,510
Cost of equipment ................................................................................................ 150,832 222,766 300,871 476,877 597,233
Selling, general and administrative expenses (excluding depreciation and
amortization disclosed separately below).......................................................... 94,073 131,510 162,476 243,618 352,020
Depreciation and amortization ............................................................................. 42,428 62,201 87,895 135,028 178,202
Loss (gain) on disposal of assets......................................................................... 392 3,209 (218,203
)
8,806 655
Total operating expenses..................................................................................... 409,936 620,492 616,251 1,309,610 1,775,620
Income from operations......................................................................................... 41,173 127,758 422,177 237,253 460,114
Other expense (income):
Interest expense .................................................................................................... 11,115 19,030 58,033 115,985 201,746
Accretion of put option in majority-owned subsidiary........................................ — 8 252 770 1,003
Interest and other income ..................................................................................... (996) (2,472) (8,658
)
(21,543
)
(63,936
)
Impairment loss on investment securities ............................................................ — — — — 97,800
(Gain) loss on extinguishment of debt ................................................................. (603) (698) 46,448 51,518 —
Total other expense ............................................................................................. 9,516 15,868 96,075 146,730 236,613
Income before provision for income taxes and cumulative effect of change in
accounting principle............................................................................................ 31,657 111,890 326,102 90,523 223,501
Provision for income taxes .................................................................................... (16,179) (47,000) (127,425
)
(36,717
)
(123,098
)
Income before cumulative effect of change in accounting principle.................... 15,478 64,890 198,677 53,806 100,403
Cumulative effect of change in accounting, net of tax ......................................... (120) — — — —
Net income............................................................................................................. 15,358 64,890 198,677 53,806 100,403
Accrued dividends on Series D Preferred Stock................................................... (18,493) (21,006) (21,006
)
(21,006
)
(6,499
)
Accrued dividends on Series E Preferred Stock ................................................... — — (1,019
)
(3,000
)
(929
)
Accretion on Series D Preferred Stock ................................................................. (473) (473) (473
)
(473
)
(148
)
Accretion on Series E Preferred Stock.................................................................. — — (114
)
(339
)
(106
)
Net income (loss) applicable to Common Stock................................................... $ (3,608) $ 43,411 $ 176,065 $ 28,988 $ 92,721
Basic net income (loss) per common share(1):
Income (loss) before cumulative effect of change in accounting principle $ (0.03) $ 0.18 $ 0.71 $ 0.11 $ 0.29
Cumulative effect of change in accounting, net of tax ....................................... (0.00) — — — —
Basic net income (loss) per common share.......................................................... $ (0.03) $ 0.18 $ 0.71 $ 0.11 $ 0.29
Diluted net income (loss) per common share(1):
Income (loss) before cumulative effect of change in accounting principle $ (0.03) $ 0.15 $ 0.62 $ 0.10 $ 0.28
Cumulative effect of change in accounting, net of tax ....................................... (0.00) — — — —
Diluted net income (loss) per common share....................................................... $ (0.03) $ 0.15 $ 0.62 $ 0.10 $ 0.28
Weighted average shares(1):
Basic .................................................................................................................... 109,331,885 126,722,051 135,352,396 155,820,381 287,692,280
Diluted ................................................................................................................. 109,331,885 150,633,686 153,610,589 159,696,608 296,337,724
Year Ended December 31,
2003 2004 2005 2006 2007
(In Thousands)
Other Financial Data:
Net cash provided by operating activities ......................... $ 112,605 $ 150,379 $ 283,216 $ 364,761 $ 589,306
Net cash used in investment activities .............................. (306,868) (190,881) (905,228) (1,939,665) (517,088)
Net cash provided by (used in) financing activities.......... 201,951 (5,433) 712,244 1,623,693 1,236,492