Metro PCS 2007 Annual Report Download - page 136
Download and view the complete annual report
Please find page 136 of the 2007 Metro PCS annual report below. You can navigate through the pages in the report by either clicking on the pages listed below, or by using the keyword search tool below to find specific information within the annual report.-
 1
1 -
2
-
3
-
4
-
5
-
6
-
7
-
8
-
9
-
10
-
11
-
12
-
13
-
14
-
15
-
16
-
17
-
18
-
19
-
20
-
21
-
22
-
23
-
24
-
25
-
26
-
27
-
28
-
29
-
30
-
31
-
32
-
33
-
34
-
35
-
36
-
37
-
38
-
39
-
40
-
41
-
42
-
43
-
44
-
45
-
46
-
47
-
48
-
49
-
50
-
51
-
52
-
53
-
54
-
55
-
56
-
57
-
58
-
59
-
60
-
61
-
62
-
63
-
64
-
65
-
66
-
67
-
68
-
69
-
70
-
71
-
72
-
73
-
74
-
75
-
76
-
77
-
78
-
79
-
80
-
81
-
82
-
83
-
84
-
85
-
86
-
87
-
88
-
89
-
90
-
91
-
92
-
93
-
94
-
95
-
96
-
97
-
98
-
99
-
100
-
101
-
102
-
103
-
104
-
105
-
106
-
107
-
108
-
109
-
110
-
111
-
112
-
113
-
114
-
115
-
116
-
117
-
118
-
119
-
120
-
121
-
122
-
123
-
124
-
125
-
 126
126 -
 127
127 -
 128
128 -
 129
129 -
 130
130 -
 131
131 -
 132
132 -
 133
133 -
 134
134 -
 135
135 -
 136
136 -
 137
137 -
 138
138 -
 139
139 -
 140
140 -
 141
141 -
 142
142 -
 143
143 -
 144
144 -
 145
145 -
 146
146 -
147
-
148
-
149
-
150
-
151
-
152
-
153
-
154
-
155
-
156
-
157
-
158
-
159
-
160
 |
 |

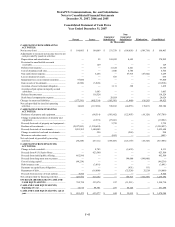
MetroPCS Communications, Inc. and Subsidiaries
Notes to Consolidated Financial Statements
December 31, 2007, 2006 and 2005
F-37
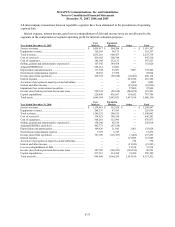
All intercompany transactions between reportable segments have been eliminated in the presentation of operating
segment data.
Interest expense, interest income, gain/loss on extinguishment of debt and income taxes are not allocated to the
segments in the computation of segment operating profit for internal evaluation purposes.
Year Ended December 31, 2007
Core
Markets
Expansion
Markets
Other
Total
Service revenues ....................................................................... $ 1,414,917 $ 504,280 $ — $ 1,919,197
Equipment revenues.................................................................. 220,364 96,173 — 316,537
Total revenues........................................................................... 1,635,281 600,453 — 2,235,734
Cost of service(1)...................................................................... 439,162 208,348 — 647,510
Cost of equipment..................................................................... 385,100 212,133 — 597,233
Selling, general and administrative expenses(2) ....................... 167,542 184,478 — 352,020
Adjusted EBITDA(3)................................................................ 654,112 12,883 —
Depreciation and amortization.................................................. 117,344 53,851 7,007 178,202
Stock-based compensation expense.......................................... 10,635 17,389 — 28,024
Income (loss) from operations .................................................. 529,194 (58,818) (10,262) 460,114
Interest expense ........................................................................ — — 201,746 201,746
Accretion of put option in majority-owned subsidiary.............. — — 1,003 1,003
Interest and other income.......................................................... — — (63,936) (63,936)
Impairment loss on investment securities ................................. — — 97,800 97,800
Income (loss) before provision for income taxes ...................... 529,194 (58,818) (246,875) 223,501
Capital expenditures ................................................................. 220,490 436,567 110,652 767,709
Total assets ............................................................................... 1,064,384 2,883,832 1,857,914 5,806,130
Year Ended December 31, 2006
Core
Markets
Expansion
Markets
Other
Total
Service revenues ....................................................................... $ 1,138,019 $ 152,928 $ — $ 1,290,947
Equipment revenues.................................................................. 208,333 47,583 — 255,916
Total revenues........................................................................... 1,346,352 200,511 — 1,546,863
Cost of service(1)...................................................................... 338,923 106,358 — 445,281
Cost of equipment..................................................................... 364,281 112,596 — 476,877
Selling, general and administrative expenses(2) ....................... 158,100 85,518 — 243,618
Adjusted EBITDA (deficit)(3).................................................. 492,773 (97,214) —
Depreciation and amortization.................................................. 109,626 21,941 3,461 135,028
Stock-based compensation expense.......................................... 7,725 6,747 — 14,472
Income (loss) from operations .................................................. 367,109 (126,387) (3,469) 237,253
Interest expense ........................................................................ — — 115,985 115,985
Accretion of put option in majority-owned subsidiary.............. — — 770 770
Interest and other income.......................................................... — — (21,543) (21,543)
Loss on extinguishment of debt ................................................ — — 51,518 51,518
Income (loss) before provision for income taxes ...................... 367,109 (126,387) (150,199) 90,523
Capital expenditures ................................................................. 217,215 314,308 19,226 550,749
Total assets(4)........................................................................... 945,699 1,064,243 2,143,180 4,153,122