Metro PCS 2007 Annual Report Download - page 110
Download and view the complete annual report
Please find page 110 of the 2007 Metro PCS annual report below. You can navigate through the pages in the report by either clicking on the pages listed below, or by using the keyword search tool below to find specific information within the annual report.-
 1
1 -
2
-
3
-
4
-
5
-
6
-
7
-
8
-
9
-
10
-
11
-
12
-
13
-
14
-
15
-
16
-
17
-
18
-
19
-
20
-
21
-
22
-
23
-
24
-
25
-
26
-
27
-
28
-
29
-
30
-
31
-
32
-
33
-
34
-
35
-
36
-
37
-
38
-
39
-
40
-
41
-
42
-
43
-
44
-
45
-
46
-
47
-
48
-
49
-
50
-
51
-
52
-
53
-
54
-
55
-
56
-
57
-
58
-
59
-
60
-
61
-
62
-
63
-
64
-
65
-
66
-
67
-
68
-
69
-
70
-
71
-
72
-
73
-
74
-
75
-
76
-
77
-
78
-
79
-
80
-
81
-
82
-
83
-
84
-
85
-
86
-
87
-
88
-
89
-
90
-
91
-
92
-
93
-
94
-
95
-
96
-
97
-
98
-
99
-
 100
100 -
 101
101 -
 102
102 -
 103
103 -
 104
104 -
 105
105 -
 106
106 -
 107
107 -
 108
108 -
 109
109 -
 110
110 -
 111
111 -
 112
112 -
 113
113 -
 114
114 -
 115
115 -
 116
116 -
 117
117 -
 118
118 -
 119
119 -
 120
120 -
121
-
122
-
123
-
124
-
125
-
126
-
127
-
128
-
129
-
130
-
131
-
132
-
133
-
134
-
135
-
136
-
137
-
138
-
139
-
140
-
141
-
142
-
143
-
144
-
145
-
146
-
147
-
148
-
149
-
150
-
151
-
152
-
153
-
154
-
155
-
156
-
157
-
158
-
159
-
160
 |
 |

MetroPCS Communications, Inc. and Subsidiaries
Notes to Consolidated Financial Statements
December 31, 2007, 2006 and 2005
F-11
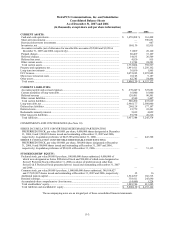
Property and Equipment
Property and equipment, net, consisted of the following (in thousands):
2007 2006
Construction-in-progress ..................................................................................... $ 393,282 $ 193,856
Network infrastructure......................................................................................... 1,901,119 1,329,986
Office equipment................................................................................................. 44,059 31,065
Leasehold improvements..................................................................................... 33,410 21,721
Furniture and fixtures .......................................................................................... 7,833 5,903
Vehicles............................................................................................................... 207 207
2,379,910 1,582,738
Accumulated depreciation ................................................................................... (488,499) (326,576)
Property and equipment, net................................................................................ $ 1,891,411 $ 1,256,162
Property and equipment are stated at cost. Additions and improvements are capitalized, while expenditures that
do not enhance or extend the asset’ s useful life are charged to operating expenses as incurred. When the Company
sells, disposes of or retires property and equipment, the related gains or losses are included in operating results.
Depreciation is applied using the straight-line method over the estimated useful lives of the assets once the assets are
placed in service, which are seven to ten years for network infrastructure assets, three to seven years for office
equipment, which includes computer equipment, three to seven years for furniture and fixtures and five years for
vehicles. Leasehold improvements are amortized over the shorter of the remaining term of the lease and any renewal
periods reasonably assured or the estimated useful life of the improvement. Maintenance and repair costs are
charged to expense as incurred. The Company follows the provisions of SFAS No. 34, “Capitalization of Interest
Cost,” with respect to its FCC licenses and the related construction of its network infrastructure assets.
Capitalization commences with pre-construction period administrative and technical activities, which includes
obtaining leases, zoning approvals and building permits, and ceases at the point in which the asset is ready for its
intended use, which generally coincides with the market launch date. For the years ended December 31, 2007, 2006
and 2005, the Company capitalized interest in the amount of $34.9 million, $17.5 million and $3.6 million,
respectively.
Impairment of Long-Lived Assets
The Company assesses potential impairments to its long-lived assets, including property and equipment, when
there is evidence that events or changes in circumstances indicate that the carrying value may not be recoverable. An
impairment loss may be required to be recognized when the undiscounted cash flows expected to be generated by a
long-lived asset (or group of such assets) is less than its carrying value. Any required impairment loss would be
measured as the amount by which the asset’ s carrying value exceeds its fair value and would be recorded as a
reduction in the carrying value of the related asset and charged to results of operations.
Long-Term Investments
The Company accounts for its investment securities in accordance with SFAS No. 115, “Accounting for Certain
Investments in Debt and Equity Securities.” At December 31, 2007, all of the Company’ s long-term investment
securities were reported at fair value. Due to the lack of availability of observable market quotes on the Company’ s
investment portfolio of auction rate securities, the fair value was estimated based on the Company’ s broker-dealer
valuation models and an internal analysis by management of other-than-temporary impairment factors. The broker-
dealer models considered credit default risks, the liquidity of the underlying security and overall capital market
liquidity. Management also looked to other marketplace transactions, and information received from other third
party brokers in order to assess whether the fair value based on the broker-dealer valuation models was reasonable.
Declines in fair value that are considered other-than-temporary are charged to earnings.
The valuation of the Company’ s investment portfolio is subject to uncertainties that are difficult to predict.
Factors that may impact the Company’ s valuation include changes to credit ratings of the securities as well as the
underlying assets supporting those securities, rates of default of the underlying assets, underlying collateral values,
discount rates, counterparty risk and ongoing strength and quality of market credit and liquidity (See Note 4).