Metro PCS 2007 Annual Report Download - page 148
Download and view the complete annual report
Please find page 148 of the 2007 Metro PCS annual report below. You can navigate through the pages in the report by either clicking on the pages listed below, or by using the keyword search tool below to find specific information within the annual report.-
 1
1 -
2
-
3
-
4
-
5
-
6
-
7
-
8
-
9
-
10
-
11
-
12
-
13
-
14
-
15
-
16
-
17
-
18
-
19
-
20
-
21
-
22
-
23
-
24
-
25
-
26
-
27
-
28
-
29
-
30
-
31
-
32
-
33
-
34
-
35
-
36
-
37
-
38
-
39
-
40
-
41
-
42
-
43
-
44
-
45
-
46
-
47
-
48
-
49
-
50
-
51
-
52
-
53
-
54
-
55
-
56
-
57
-
58
-
59
-
60
-
61
-
62
-
63
-
64
-
65
-
66
-
67
-
68
-
69
-
70
-
71
-
72
-
73
-
74
-
75
-
76
-
77
-
78
-
79
-
80
-
81
-
82
-
83
-
84
-
85
-
86
-
87
-
88
-
89
-
90
-
91
-
92
-
93
-
94
-
95
-
96
-
97
-
98
-
99
-
100
-
101
-
102
-
103
-
104
-
105
-
106
-
107
-
108
-
109
-
110
-
111
-
112
-
113
-
114
-
115
-
116
-
117
-
118
-
119
-
120
-
121
-
122
-
123
-
124
-
125
-
126
-
127
-
128
-
129
-
130
-
131
-
132
-
133
-
134
-
135
-
136
-
137
-
 138
138 -
 139
139 -
 140
140 -
 141
141 -
 142
142 -
 143
143 -
 144
144 -
 145
145 -
 146
146 -
 147
147 -
 148
148 -
 149
149 -
 150
150 -
 151
151 -
 152
152 -
 153
153 -
 154
154 -
 155
155 -
 156
156 -
 157
157 -
 158
158 -
159
-
160
 |
 |

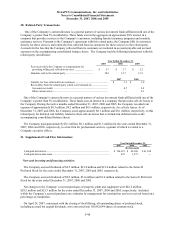
MetroPCS Communications, Inc. and Subsidiaries
Notes to Consolidated Financial Statements
December 31, 2007, 2006 and 2005
F-49
See Note 2 for the non-cash increase in the Company’ s asset retirement obligations.
22. Fair Value of Financial Instruments:
The following methods and assumptions were used to estimate the fair value of each class of financial
instruments for which it is practicable to estimate that value:
Long-Term Debt
The fair value of the Company’ s long-term debt is estimated based on the quoted market prices for the same or
similar issues or on the current rates offered to the Company for debt of the same remaining maturities.
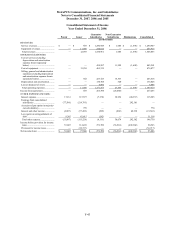
The estimated fair values of the Company’ s financial instruments are as follows (in thousands):
2007 2006
Carrying
Amount
Fair Value
Carrying
Amount
Fair Value
Senior Secured Credit Facility........................................................ $ 1,580,000 $ 1,607,734 $ 1,596,000 $ 1,597,219
9¼% Senior Notes.......................................................................... 1,400,000 1,314,250 1,000,000 1,032,500
Cash flow hedging derivatives........................................................ (23,502) (23,502) 1,865 1,865
Short-term investments................................................................... — — 390,651 390,651
Long-term investments................................................................... 36,050 36,050 390,651 390,651
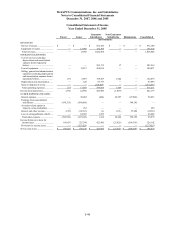
23. Quarterly Financial Data (Unaudited):
The following financial information reflects all normal recurring adjustments that are, in the opinion of
management, necessary for a fair statement of the Company’ s results of operations for the interim periods.
Summarized data for each interim period for the years ended December 31, 2007 and 2006 is as follows (in
thousands, except per share data):
Three Months Ended
March 31,
2007
June 30,
2007
September 30,
2007
December 31,
2007
Total revenues .................................................................. $ 536,686 $ 551,176 $ 556,738 $ 591,134
Income from operations.................................................... 102,676 132,062 133,138 92,238
Net income (loss)(1)......................................................... 36,352 58,094 53,108 (47,150)
Net income (loss) per common share — basic ................. $ 0.11 $ 0.17 $ 0.15 $ (0.14)
Net income (loss) per common share — diluted............... $ 0.11 $ 0.17 $ 0.15 $ (0.14)
Three Months Ended
March 31,
2006
June 30,
2006
September 30,
2006
December 31,
2006
Total revenues .................................................................. $ 329,461 $ 368,194 $ 396,116 $ 453,092
Income from operations.................................................... 46,999 54,099 69,394 66,761
Net income (loss)(2)......................................................... 18,369 22,989 29,266 (16,818)
Net income (loss) per common share — basic ................. $ 0.04 $ 0.06 $ 0.08 $ (0.15)
Net income (loss) per common share — diluted............... $ 0.04 $ 0.06 $ 0.08 $ (0.15)
__________
(1) During the three months ended September 30, 2007 and December 31, 2007, the Company recognized an impairment loss on investment
securities in the amount of approximately $ 15.0 million and $82.8 million, respectively.
(2) During the three months ended December 31, 2006, the Company repaid all of its outstanding obligations under the credit agreements,
the secured bridge credit facility and the unsecured bridge credit facility resulting in a loss on extinguishment of debt in the amount of
approximately $51.8 million.