Metro PCS 2007 Annual Report Download - page 75
Download and view the complete annual report
Please find page 75 of the 2007 Metro PCS annual report below. You can navigate through the pages in the report by either clicking on the pages listed below, or by using the keyword search tool below to find specific information within the annual report.-
 1
1 -
2
-
3
-
4
-
5
-
6
-
7
-
8
-
9
-
10
-
11
-
12
-
13
-
14
-
15
-
16
-
17
-
18
-
19
-
20
-
21
-
22
-
23
-
24
-
25
-
26
-
27
-
28
-
29
-
30
-
31
-
32
-
33
-
34
-
35
-
36
-
37
-
38
-
39
-
40
-
41
-
42
-
43
-
44
-
45
-
46
-
47
-
48
-
49
-
50
-
51
-
52
-
53
-
54
-
55
-
56
-
57
-
58
-
59
-
60
-
61
-
62
-
63
-
64
-
 65
65 -
 66
66 -
 67
67 -
 68
68 -
 69
69 -
 70
70 -
 71
71 -
 72
72 -
 73
73 -
 74
74 -
 75
75 -
 76
76 -
 77
77 -
 78
78 -
 79
79 -
 80
80 -
 81
81 -
 82
82 -
 83
83 -
 84
84 -
 85
85 -
86
-
87
-
88
-
89
-
90
-
91
-
92
-
93
-
94
-
95
-
96
-
97
-
98
-
99
-
100
-
101
-
102
-
103
-
104
-
105
-
106
-
107
-
108
-
109
-
110
-
111
-
112
-
113
-
114
-
115
-
116
-
117
-
118
-
119
-
120
-
121
-
122
-
123
-
124
-
125
-
126
-
127
-
128
-
129
-
130
-
131
-
132
-
133
-
134
-
135
-
136
-
137
-
138
-
139
-
140
-
141
-
142
-
143
-
144
-
145
-
146
-
147
-
148
-
149
-
150
-
151
-
152
-
153
-
154
-
155
-
156
-
157
-
158
-
159
-
160
 |
 |
64
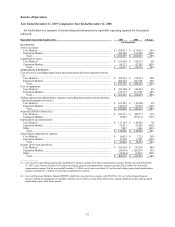
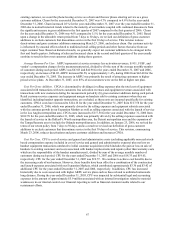
Cost of Equipment: Cost of equipment increased $176.0 million, or 59%, to $476.9 million for the year ended
December 31, 2006 from $300.9 million for the year ended December 31, 2005. The increase is due to increases
in Core Markets and Expansion Markets cost of equipment as follows:
• Core Markets. Core Markets cost of equipment increased $70.6 million, or 24%, to $364.3 million for the
year ended December 31, 2006 from $293.7 million for the year ended December 31, 2005. The increase in
equipment costs is primarily attributable to the sale of higher cost handset models accounting for
$44.7 million of the increase. The increase in gross customer additions during the year of approximately
130,000 customers as well as the sale of new handsets to existing customers accounted for $25.9 million of
the increase.
• Expansion Markets. Expansion Markets costs of equipment increased $105.4 million to $112.6 million for
the year ended December 31, 2006 from $7.2 million for the year ended December 31, 2005. These costs
were primarily attributable to the launch of the Tampa/Sarasota metropolitan area in October 2005, the
Dallas/Ft. Worth metropolitan area in March 2006, the Detroit metropolitan area in April 2006 and the
expansion of the Tampa/Sarasota area to include the Orlando metropolitan area in November 2006.
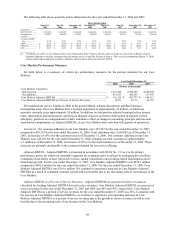
Selling, General and Administrative Expenses. Selling, general and administrative expenses increased
$81.1 million, or 50%, to $243.6 million for the year ended December 31, 2006 from $162.5 million for the year
ended December 31, 2005. The increase is due to increases in Core Markets and Expansion Markets selling, general
and administrative expenses as follows:
• Core Markets. Core Markets selling, general and administrative expenses increased $4.8 million, or 3%, to
$158.1 million for the year ended December 31, 2006 from $153.3 million for the year ended December 31,
2005. Selling expenses increased by $10.7 million, or approximately 18% for the year ended December 31,
2006 compared to year ended December 31, 2005. General and administrative expenses decreased by
$5.9 million, or approximately 6% for the year ended December 31, 2006 compared to the year ended
December 31, 2005. The increase in selling expenses is primarily due to an increase in advertising and
market research expenses which were incurred to support the growth in the Core Markets. This increase in
selling expenses was offset by a decrease in general and administrative expenses, which were higher in 2005
because they included approximately $5.9 million in legal and accounting expenses associated with an
internal investigation related to material weaknesses in our internal control over financial reporting as well as
financial statement audits related to our restatement efforts.
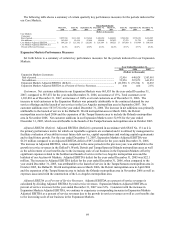
• Expansion Markets. Expansion Markets selling, general and administrative expenses increased $76.3 million
to $85.5 million for the year ended December 31, 2006 from $9.2 million for the year ended December 31,
2005. Selling expenses increased $31.5 million for the year ended December 31, 2006 compared to the year
ended December 31, 2005. This increase in selling expenses was related to marketing and advertising
expenses associated with the launch of the Dallas/Ft. Worth metropolitan area, the Detroit metropolitan area,
and the expansion of the Tampa/Sarasota area to include the Orlando metropolitan area. General and
administrative expenses increased by $44.8 million for the year ended December 31, 2006 compared to the
same period in 2005 due to labor, rent, legal and professional fees and various administrative expenses
incurred in relation to the launch of the Dallas/Ft. Worth metropolitan area, Detroit metropolitan area, and the
expansion of the Tampa/Sarasota area to include the Orlando metropolitan area as well as build-out expenses
related to the Los Angeles metropolitan area.
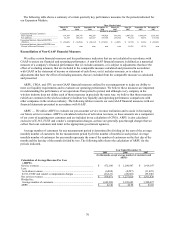
Depreciation and Amortization. Depreciation and amortization expense increased $47.1 million, or 54%, to
$135.0 million for the year ended December 31, 2006 from $87.9 million for the year ended December 31, 2005.
The increase is primarily due to increases in Core Markets and Expansion Markets depreciation and amortization
expense as follows:
• Core Markets. Core Markets depreciation and amortization expense increased $25.2 million, or 30%, to
$109.6 million for the year ended December 31, 2006 from $84.4 million for the year ended December 31,
2005. The increase related primarily to an increase in network infrastructure assets placed into service during
the year ended December 31, 2006. We added approximately 350 cell sites in our Core Markets during this
period to increase the capacity of our existing network and expand our footprint.