Metro PCS 2007 Annual Report Download - page 106
Download and view the complete annual report
Please find page 106 of the 2007 Metro PCS annual report below. You can navigate through the pages in the report by either clicking on the pages listed below, or by using the keyword search tool below to find specific information within the annual report.-
 1
1 -
2
-
3
-
4
-
5
-
6
-
7
-
8
-
9
-
10
-
11
-
12
-
13
-
14
-
15
-
16
-
17
-
18
-
19
-
20
-
21
-
22
-
23
-
24
-
25
-
26
-
27
-
28
-
29
-
30
-
31
-
32
-
33
-
34
-
35
-
36
-
37
-
38
-
39
-
40
-
41
-
42
-
43
-
44
-
45
-
46
-
47
-
48
-
49
-
50
-
51
-
52
-
53
-
54
-
55
-
56
-
57
-
58
-
59
-
60
-
61
-
62
-
63
-
64
-
65
-
66
-
67
-
68
-
69
-
70
-
71
-
72
-
73
-
74
-
75
-
76
-
77
-
78
-
79
-
80
-
81
-
82
-
83
-
84
-
85
-
86
-
87
-
88
-
89
-
90
-
91
-
92
-
93
-
94
-
95
-
 96
96 -
 97
97 -
 98
98 -
 99
99 -
 100
100 -
 101
101 -
 102
102 -
 103
103 -
 104
104 -
 105
105 -
 106
106 -
 107
107 -
 108
108 -
 109
109 -
 110
110 -
 111
111 -
 112
112 -
 113
113 -
 114
114 -
 115
115 -
 116
116 -
117
-
118
-
119
-
120
-
121
-
122
-
123
-
124
-
125
-
126
-
127
-
128
-
129
-
130
-
131
-
132
-
133
-
134
-
135
-
136
-
137
-
138
-
139
-
140
-
141
-
142
-
143
-
144
-
145
-
146
-
147
-
148
-
149
-
150
-
151
-
152
-
153
-
154
-
155
-
156
-
157
-
158
-
159
-
160
 |
 |

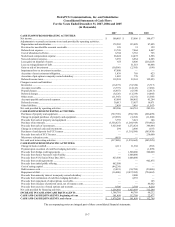
F-7
MetroPCS Communications, Inc. and Subsidiaries
Consolidated Statements of Cash Flows
For the Years Ended December 31, 2007, 2006 and 2005
(in thousands)
2007 2006 2005
CASH FLOWS FROM OPERATING ACTIVITIES:
Net income.................................................................................................................. $ 100,403 $ 53,806 $ 198,677
Adjustments to reconcile net income to net cash provided by operating activities:
Depreciation and amortization ................................................................................... 178,202 135,028 87,895
Provision for uncollectible accounts receivable ......................................................... 129 31 129
Deferred rent expense ................................................................................................ 13,745 7,464 4,407
Cost of abandoned cell sites....................................................................................... 6,704 3,783 725
Stock-based compensation expense ........................................................................... 28,024 14,472 2,596
Non-cash interest expense.......................................................................................... 3,259 6,964 4,285
Loss (gain) on disposal of assets ................................................................................ 655 8,806 (218,203)
Loss on extinguishment of debt ................................................................................. — 51,518 46,448
Gain on sale of investments ....................................................................................... (10,506) (2,385) (190)
Impairment loss on investment securities................................................................... 97,800 — —
Accretion of asset retirement obligation..................................................................... 1,439 769 423
Accretion of put option in majority-owned subsidiary............................................... 1,003 770 252
Deferred income taxes................................................................................................ 118,524 32,341 125,055
Changes in assets and liabilities:
Inventories ................................................................................................................. (16,275) (53,320) (5,717)
Accounts receivable ................................................................................................... (3,797) (12,143) (7,056)
Prepaid charges .......................................................................................................... (6,887) (6,538) (2,613)
Deferred charges ........................................................................................................ (8,126) (13,239) (4,045)
Other assets ................................................................................................................ (11,345) (9,231) (5,580)
Accounts payable and accrued expenses.................................................................... 63,884 108,492 41,204
Deferred revenue........................................................................................................ 30,013 33,957 16,071
Other liabilities........................................................................................................... 2,458 3,416 (1,547)
Net cash provided by operating activities.................................................................... 589,306 364,761 283,216
CASH FLOWS FROM INVESTING ACTIVITIES:
Purchases of property and equipment......................................................................... (767,709) (550,749) (266,499)
Change in prepaid purchases of property and equipment........................................... (19,992) (5,262) (11,800)
Proceeds from sale of property and equipment .......................................................... 3,759 3,021 146
Purchase of investments............................................................................................. (3,358,427) (1,269,919) (739,482)
Proceeds from sale of investments ............................................................................. 3,625,648 1,272,424 386,444
Change in restricted cash and investments ................................................................. 294 2,406 (107)
Purchases of and deposits for FCC licenses ............................................................... — (1,391,586) (503,930)
Proceeds from sale of FCC licenses........................................................................... — — 230,000
Microwave relocation costs........................................................................................ (661) — —
Net cash used in investing activities............................................................................ (517,088) (1,939,665) (905,228)
CASH FLOWS FROM FINANCING ACTIVITIES:
Change in book overdraft........................................................................................... 4,111 11,368 (565)
Payment upon execution of cash flow hedging derivative ......................................... — — (1,899)
Proceeds from bridge credit agreements .................................................................... — 1,500,000 540,000
Proceeds from Senior Secured Credit Facility............................................................ — 1,600,000 —
Proceeds from 9¼% Senior Notes Due 2014 ............................................................. 423,500 1,000,000 —
Proceeds from credit agreements ............................................................................... — — 902,875
Proceeds from initial public offering.......................................................................... 862,500 — —
Cost of raising capital ................................................................................................ (44,234) — —
Debt issuance costs .................................................................................................... (3,091) (58,789) (29,480)
Repayment of debt ..................................................................................................... (16,000) (2,437,985) (754,662)
Proceeds from minority interest in majority-owned subsidiary.................................. — 2,000 —
Proceeds from termination of cash flow hedging derivative ...................................... — 4,355 —
Proceeds from repayment of subscriptions receivable................................................ — — 103
Proceeds from issuance of preferred stock, net of issuance costs............................... — — 46,662
Proceeds from exercise of stock options and warrants ............................................... 9,706 2,744 9,210
Net cash provided by financing activities.................................................................... 1,236,492 1,623,693 712,244
INCREASE IN CASH AND CASH EQUIVALENTS............................................ 1,308,710 48,789 90,232
CASH AND CASH EQUIVALENTS, beginning of year....................................... 161,498 112,709 22,477
CASH AND CASH EQUIVALENTS, end of year ................................................. $ 1,470,208 $ 161,498 $ 112,709
The accompanying notes are integral part of these consolidated financial statements.