Metro PCS 2007 Annual Report Download - page 83
Download and view the complete annual report
Please find page 83 of the 2007 Metro PCS annual report below. You can navigate through the pages in the report by either clicking on the pages listed below, or by using the keyword search tool below to find specific information within the annual report.-
 1
1 -
2
-
3
-
4
-
5
-
6
-
7
-
8
-
9
-
10
-
11
-
12
-
13
-
14
-
15
-
16
-
17
-
18
-
19
-
20
-
21
-
22
-
23
-
24
-
25
-
26
-
27
-
28
-
29
-
30
-
31
-
32
-
33
-
34
-
35
-
36
-
37
-
38
-
39
-
40
-
41
-
42
-
43
-
44
-
45
-
46
-
47
-
48
-
49
-
50
-
51
-
52
-
53
-
54
-
55
-
56
-
57
-
58
-
59
-
60
-
61
-
62
-
63
-
64
-
65
-
66
-
67
-
68
-
69
-
70
-
71
-
72
-
 73
73 -
 74
74 -
 75
75 -
 76
76 -
 77
77 -
 78
78 -
 79
79 -
 80
80 -
 81
81 -
 82
82 -
 83
83 -
 84
84 -
 85
85 -
 86
86 -
 87
87 -
 88
88 -
 89
89 -
 90
90 -
 91
91 -
 92
92 -
 93
93 -
94
-
95
-
96
-
97
-
98
-
99
-
100
-
101
-
102
-
103
-
104
-
105
-
106
-
107
-
108
-
109
-
110
-
111
-
112
-
113
-
114
-
115
-
116
-
117
-
118
-
119
-
120
-
121
-
122
-
123
-
124
-
125
-
126
-
127
-
128
-
129
-
130
-
131
-
132
-
133
-
134
-
135
-
136
-
137
-
138
-
139
-
140
-
141
-
142
-
143
-
144
-
145
-
146
-
147
-
148
-
149
-
150
-
151
-
152
-
153
-
154
-
155
-
156
-
157
-
158
-
159
-
160
 |
 |

72
Three Months Ended
March 31,
2006
June 30,
2006
September 30,
2006
December 31,
2006
(In thousands, except gross customer additions and CPGA)
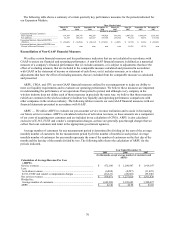
Calculation of Cost Per Gross Addition (CPGA):
Selling expenses ............................................................................... $ 20,298 $ 26,437 $ 26,062 $ 31,823
Less:
Activation revenues ....................................................................... (1,923) (1,979) (2,123) (2,272)
Less:
Equipment revenues ...................................................................... (54,045) (60,351) (63,196) (78,324)
Add:
Equipment revenue not associated with new customers ................ 24,864 26,904 28,802 33,822
Add:
Cost of equipment.......................................................................... 100,911 112,005 117,982 145,979
Less:
Equipment costs not associated with new customers..................... (35,364) (34,669) (38,259) (47,638)
Gross addition expenses.................................................................... $ 54,741 $ 68,347 $ 69,268 $ 83,390
Divided by:
Gross customer additions............................................................... 515,153 559,309 575,820 694,853
CPGA ............................................................................................... $ 106.26 $ 122.20 $ 120.29 $ 120.01
Three Months Ended
March 31,
2007
June 30,
2007
September 30,
2007
December 31,
2007
(In thousands, except gross customer additions and CPGA)
Calculation of Cost Per Gross Addition (CPGA):
Selling expenses ............................................................................... $ 30,106 $ 33,365 $ 35,625 $ 53,969
Less:
Activation revenues ....................................................................... (2,459) (2,683) (2,995) (3,287)
Less:
Equipment revenues ...................................................................... (97,170) (71,835) (67,607) (79,925)
Add:
Equipment revenue not associated with new customers ................ 42,009 33,892 31,590 35,330
Add:
Cost of equipment.......................................................................... 173,308 133,439 131,179 159,308
Less:
Equipment costs not associated with new customers..................... (55,169) (43,795) (43,254) (49,936)
Gross addition expenses.................................................................... $ 90,625 $ 82,383 $ 84,538 $ 115,459
Divided by:
Gross customer additions............................................................... 832,983 660,149 671,379 839,666
CPGA ............................................................................................... $ 108.80 $ 124.79 $ 125.92 $ 137.51
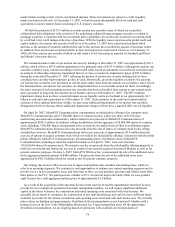
CPU — CPU is cost of service and general and administrative costs (excluding applicable non-cash stock-based
compensation expense included in cost of service and general and administrative expense) plus net loss on
equipment transactions unrelated to initial customer acquisition (which includes the gain or loss on sale of handsets
to existing customers and costs associated with handset replacements and repairs (other than warranty costs which
are the responsibility of the handset manufacturers)) exclusive of E-911, FUSF and vendor’ s compensation charges,
divided by the sum of the average monthly number of customers during such period. CPU does not include any
depreciation and amortization expense. Management uses CPU as a tool to evaluate the non-selling cash expenses
associated with ongoing business operations on a per customer basis, to track changes in these non-selling cash costs
over time, and to help evaluate how changes in our business operations affect non-selling cash costs per customer. In
addition, CPU provides management with a useful measure to compare our non-selling cash costs per customer with
those of other wireless providers. We believe investors use CPU primarily as a tool to track changes in our non-
selling cash costs over time and to compare our non-selling cash costs to those of other wireless providers. Other
wireless carriers may calculate this measure differently. The following table reconciles total costs used in the
calculation of CPU to cost of service, which we consider to be the most directly comparable GAAP financial
measure to CPU.