Metro PCS 2007 Annual Report Download - page 17
Download and view the complete annual report
Please find page 17 of the 2007 Metro PCS annual report below. You can navigate through the pages in the report by either clicking on the pages listed below, or by using the keyword search tool below to find specific information within the annual report.-
 1
1 -
2
-
3
-
4
-
5
-
6
-
 7
7 -
 8
8 -
 9
9 -
 10
10 -
 11
11 -
 12
12 -
 13
13 -
 14
14 -
 15
15 -
 16
16 -
 17
17 -
 18
18 -
 19
19 -
 20
20 -
 21
21 -
 22
22 -
 23
23 -
 24
24 -
 25
25 -
 26
26 -
 27
27 -
28
-
29
-
30
-
31
-
32
-
33
-
34
-
35
-
36
-
37
-
38
-
39
-
40
-
41
-
42
-
43
-
44
-
45
-
46
-
47
-
48
-
49
-
50
-
51
-
52
-
53
-
54
-
55
-
56
-
57
-
58
-
59
-
60
-
61
-
62
-
63
-
64
-
65
-
66
-
67
-
68
-
69
-
70
-
71
-
72
-
73
-
74
-
75
-
76
-
77
-
78
-
79
-
80
-
81
-
82
-
83
-
84
-
85
-
86
-
87
-
88
-
89
-
90
-
91
-
92
-
93
-
94
-
95
-
96
-
97
-
98
-
99
-
100
-
101
-
102
-
103
-
104
-
105
-
106
-
107
-
108
-
109
-
110
-
111
-
112
-
113
-
114
-
115
-
116
-
117
-
118
-
119
-
120
-
121
-
122
-
123
-
124
-
125
-
126
-
127
-
128
-
129
-
130
-
131
-
132
-
133
-
134
-
135
-
136
-
137
-
138
-
139
-
140
-
141
-
142
-
143
-
144
-
145
-
146
-
147
-
148
-
149
-
150
-
151
-
152
-
153
-
154
-
155
-
156
-
157
-
158
-
159
-
160
 |
 |

6
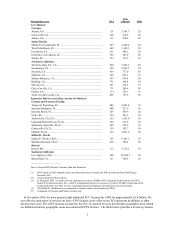
overview of our Auction 66 Markets including the FCC license area Regional Economic Area, or REA, and
Economic Area, or EA, designation, the POPs covered by the license, and the amount of AWS spectrum held at the
time of acquisition.
License
POPs
(000’s)(1)
MHz
Northeast ......................................................................................................... REA 1 50,058.1 10
West................................................................................................................. REA 6 49,999.2 10
New York-No. New Jer.-Long Island, NY-NJ-CT-PA-MA-VT(2)................. EA 10 25,712.6 10
Detroit-Ann Arbor-Flint, MI ........................................................................... EA 57 6,963.6 10
Dallas/Ft. Worth, TX-AR-OK ......................................................................... EA 127 7,645.5 10
Grand Rapids-Muskegon-Holland, MI ............................................................ EA 62 1,882.0 10
Las Vegas, NV-AZ-UT(2)............................................................................... EA 153 1,709.8 10
Shreveport-Bossier City, LA-AR .................................................................... EA 88 573.6 10
__________
Source: FCC Auction 66 Website
(1) FCC Auction 66 Website
(2) Licenses overlap other Auction 66 licenses
Our AWS licenses cover a total population of approximately 126 million outside of the metropolitan areas where
we hold or have access to spectrum. Together, our east coast Auction 66 Markets currently cover a geographic area
of approximately 52 million people, including the New York, Philadelphia and Boston metropolitan areas, and our
west coast Auction 66 Markets currently cover a geographic area of approximately 32 million people, including the
San Diego, Portland, Seattle and Las Vegas metropolitan areas. The balance of our Auction 66 Markets, which
currently cover a population of approximately 42 million, supplements or expands the geographic boundaries of our
existing operations in Dallas/Ft. Worth, Detroit, San Francisco and Sacramento, and Royal Street Communication’ s
license area in Los Angeles. We intend to focus our initial build out in our new Auction 66 Markets on metropolitan
areas with a total population coverage of approximately 40 million in major metropolitan areas with a primary focus
on the New York, Philadelphia, Boston and Las Vegas metropolitan areas.
The map below illustrates the geographic coverage of our Core and Expansion Markets.