Metro PCS 2007 Annual Report Download - page 69
Download and view the complete annual report
Please find page 69 of the 2007 Metro PCS annual report below. You can navigate through the pages in the report by either clicking on the pages listed below, or by using the keyword search tool below to find specific information within the annual report.-
 1
1 -
2
-
3
-
4
-
5
-
6
-
7
-
8
-
9
-
10
-
11
-
12
-
13
-
14
-
15
-
16
-
17
-
18
-
19
-
20
-
21
-
22
-
23
-
24
-
25
-
26
-
27
-
28
-
29
-
30
-
31
-
32
-
33
-
34
-
35
-
36
-
37
-
38
-
39
-
40
-
41
-
42
-
43
-
44
-
45
-
46
-
47
-
48
-
49
-
50
-
51
-
52
-
53
-
54
-
55
-
56
-
57
-
58
-
 59
59 -
 60
60 -
 61
61 -
 62
62 -
 63
63 -
 64
64 -
 65
65 -
 66
66 -
 67
67 -
 68
68 -
 69
69 -
 70
70 -
 71
71 -
 72
72 -
 73
73 -
 74
74 -
 75
75 -
 76
76 -
 77
77 -
 78
78 -
 79
79 -
80
-
81
-
82
-
83
-
84
-
85
-
86
-
87
-
88
-
89
-
90
-
91
-
92
-
93
-
94
-
95
-
96
-
97
-
98
-
99
-
100
-
101
-
102
-
103
-
104
-
105
-
106
-
107
-
108
-
109
-
110
-
111
-
112
-
113
-
114
-
115
-
116
-
117
-
118
-
119
-
120
-
121
-
122
-
123
-
124
-
125
-
126
-
127
-
128
-
129
-
130
-
131
-
132
-
133
-
134
-
135
-
136
-
137
-
138
-
139
-
140
-
141
-
142
-
143
-
144
-
145
-
146
-
147
-
148
-
149
-
150
-
151
-
152
-
153
-
154
-
155
-
156
-
157
-
158
-
159
-
160
 |
 |
58
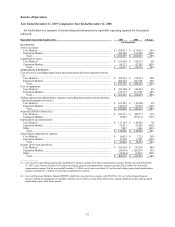
Service Revenues. Service revenues increased $628.3 million, or 49%, to $1.9 billion for the year ended
December 31, 2007 from $1.3 billion for the year ended December 31, 2006. The increase is due to increases in
Core Markets and Expansion Markets service revenues as follows:
• Core Markets. Core Markets service revenues increased $276.9 million, or 24%, to $1.4 billion for the year
ended December 31, 2007 from $1.1 billion for the year ended December 31, 2006. The increase in service
revenues is primarily attributable to net additions of approximately 358,000 customers for the year ended
December 31, 2007, which accounted for $213.2 million of the Core Markets increase, coupled with the
migration of existing customers to higher priced rate plans accounting for $10.0 million of the Core Markets
increase. In addition, E-911, Federal Universal Service Fund, or FUSF, vendor’ s compensation and
activation revenues increased approximately $53.7 million during the year ended December 31, 2007
compared to the same period in 2006 primarily as a result of the increase in customers during the year ended
December 31, 2007 and higher FUSF rates.
• Expansion Markets. Expansion Markets service revenues increased $351.4 million, or 230%, to $504.3
million for the year ended December 31, 2007 from $152.9 million for the year ended December 31, 2006.
The increase in service revenues is primarily attributable to net additions of approximately 664,000
customers for the year ended December 31, 2007, which accounted for $361.1 million of the Expansion
Markets increase, partially offset by the migration of existing customers to lower priced rate plans accounting
for a decrease of $9.7 million.
Equipment Revenues. Equipment revenues increased $60.6 million, or 24%, to $316.5 million for the year ended
December 31, 2007 from $255.9 million for the year ended December 31, 2006. The increase is due to increases in
Core Markets and Expansion Markets equipment revenues as follows:
• Core Markets. Core Markets equipment revenues increased $12.0 million, or 6%, to $220.3 million for the
year ended December 31, 2007 from $208.3 million for the year ended December 31, 2006. The increase in
Core Markets equipment revenues is attributable to an increase in gross additions of approximately 130,000
customers for the year ended December 31, 2007 offset by the sale of lower priced handsets, which
accounted for $1.9 million of the Core Markets increase, as well as an increase in handset sales to existing
customers accounting for $7.1 million of the Core Markets increase. In addition, an increase in sales of
accessories resulted in a $3.0 million increase during the year ended December 31, 2007 as compared to the
same period in 2006.
• Expansion Markets. Expansion Markets equipment revenues increased $48.6 million, or 102%, to $96.2
million for the year ended December 31, 2007 from $47.6 million for the year ended December 31, 2006.
The increase in Expansion Markets equipment revenues is attributable to an increase in gross additions of
approximately 529,000 customers for the year ended December 31, 2007 offset by the sale of lower priced
handsets, which accounted for $24.8 million of the Expansion Markets increase, as well as an increase in
handset sales to existing customers accounting for $21.3 million of the Expansion Markets increase. In
addition, an increase in sales of accessories resulted in a $2.5 million increase during the year ended
December 31, 2007 as compared to the same period in 2006.
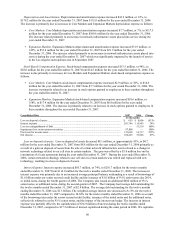
Cost of Service. Cost of service increased $202.2 million, or 45%, to $647.5 million for the year ended December
31, 2007 from $445.3 million for the year ended December 31, 2006. The increase is due to increases in Core
Markets and Expansion Markets cost of service as follows:
• Core Markets. Core Markets cost of service increased $100.2 million, or 30%, to $439.1 million for the year
ended December 31, 2007 from $338.9 million for the year ended December 31, 2006. Core Markets cost of
service (excluding E-911 and FUSF expenses) increased $46.3 million, or 16%, to $338.5 million for the
year ended December 31, 2007 from $292.2 million for the year ended December 31, 2006. The increase is
primarily attributable to net additions in the Core Markets of approximately 358,000 customers during the
year ended December 31, 2007. The increase is composed of a $16.4 million increase in customer service
expense, a $8.2 million increase in cell site and switch facility lease expense, a $4.2 million increase in data
services expense, a $3.7 million increase in employee costs and a $2.3 million increase in long distance cost,
all of which are as a result of the 16% growth in our Core Markets customer base and the deployment of
additional network infrastructure during the twelve months ended December 31, 2007. In addition, E-911
and FUSF expenses increased approximately $53.9 million during the year ended December 31, 2007
compared to the same period in 2006 primarily as a result of the increase in customers during the year ended