Metro PCS 2007 Annual Report Download - page 86
Download and view the complete annual report
Please find page 86 of the 2007 Metro PCS annual report below. You can navigate through the pages in the report by either clicking on the pages listed below, or by using the keyword search tool below to find specific information within the annual report.-
 1
1 -
2
-
3
-
4
-
5
-
6
-
7
-
8
-
9
-
10
-
11
-
12
-
13
-
14
-
15
-
16
-
17
-
18
-
19
-
20
-
21
-
22
-
23
-
24
-
25
-
26
-
27
-
28
-
29
-
30
-
31
-
32
-
33
-
34
-
35
-
36
-
37
-
38
-
39
-
40
-
41
-
42
-
43
-
44
-
45
-
46
-
47
-
48
-
49
-
50
-
51
-
52
-
53
-
54
-
55
-
56
-
57
-
58
-
59
-
60
-
61
-
62
-
63
-
64
-
65
-
66
-
67
-
68
-
69
-
70
-
71
-
72
-
73
-
74
-
75
-
 76
76 -
 77
77 -
 78
78 -
 79
79 -
 80
80 -
 81
81 -
 82
82 -
 83
83 -
 84
84 -
 85
85 -
 86
86 -
 87
87 -
 88
88 -
 89
89 -
 90
90 -
 91
91 -
 92
92 -
 93
93 -
 94
94 -
 95
95 -
 96
96 -
97
-
98
-
99
-
100
-
101
-
102
-
103
-
104
-
105
-
106
-
107
-
108
-
109
-
110
-
111
-
112
-
113
-
114
-
115
-
116
-
117
-
118
-
119
-
120
-
121
-
122
-
123
-
124
-
125
-
126
-
127
-
128
-
129
-
130
-
131
-
132
-
133
-
134
-
135
-
136
-
137
-
138
-
139
-
140
-
141
-
142
-
143
-
144
-
145
-
146
-
147
-
148
-
149
-
150
-
151
-
152
-
153
-
154
-
155
-
156
-
157
-
158
-
159
-
160
 |
 |
75
approximately 30 to 32 million by late 2008 through the first half of 2009. Our initial launch dates will vary in our
Auction 66 Markets and our launch dates in the larger metropolitan areas may be accomplished in phases. Our
Auction 66 Markets will entail a more extensive use of DAS systems than we have used in the past. This, along
with other factors, will result in an increase in the total capital expenditures per covered population to initially
launch operations, however, we would not expect the estimate of total cash expenditures to reach free cash flow
positive to be materially impacted. We believe that our existing cash and cash equivalents and our anticipated cash
flows from operations will be sufficient to fully fund this planned expansion.
The construction of our network and the marketing and distribution of our wireless communications products and
services have required, and will continue to require, substantial capital investment. Capital outlays have included
license acquisition costs, capital expenditures for construction of our network infrastructure, costs associated with
clearing and relocating non-governmental incumbent licenses, funding of operating cash flow losses incurred as we
launch services in new metropolitan areas and other working capital costs, debt service and financing fees and
expenses. Our capital expenditures for the year ended December 31, 2007 were approximately $767.7 million. Our
capital expenditures for 2006 were approximately $550.7 million and capital expenditures for 2005 were
approximately $266.5 million. These expenditures were primarily associated with the construction of the network
infrastructure in our Expansion Markets and our efforts to increase the service area and capacity of our existing Core
Markets network through the addition of cell sites and switches. We believe the increased service area and capacity
in existing markets will improve our service offering, helping us to attract additional customers and increase
revenues. In addition, we believe our new Expansion Markets have attractive demographics which will result in
increased revenues.
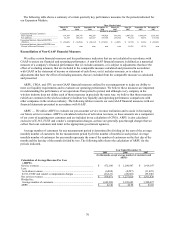
On February 20, 2007, MetroPCS Wireless, Inc. entered into an amendment to the senior secured credit facility.
Under the amendment, the margin used to determine the senior secured credit facility interest rate was reduced to
2.25% from 2.50%. As of December 31, 2007, we owed an aggregate of approximately $3.0 billion under our
senior secured credit facility and 9¼% senior notes.
Our senior secured credit facility calculates consolidated Adjusted EBITDA as: consolidated net income plus
depreciation and amortization; gain (loss) on disposal of assets; non-cash expenses; gain (loss) on extinguishment of
debt; provision for income taxes; interest expense; and certain expenses of MetroPCS Communications minus
interest and other income and non-cash items increasing consolidated net income.
We consider Adjusted EBITDA, as defined above, to be an important indicator to investors because it provides
information related to our ability to provide cash flows to meet future debt service, capital expenditures and working
capital requirements and fund future growth. We present this discussion of Adjusted EBITDA because covenants in
our senior secured credit facility contain ratios based on this measure. If our Adjusted EBITDA were to decline
below certain levels, covenants in our senior secured credit facility that are based on Adjusted EBITDA, including
our maximum senior secured leverage ratio covenant, may be violated and could cause, among other things, an
inability to incur further indebtedness and in certain circumstances a default or mandatory prepayment under our
senior secured credit facility. Our maximum senior secured leverage ratio is required to be less than 4.5 to 1.0 based
on Adjusted EBITDA plus the impact of certain new markets. The lenders under our senior secured credit facility
use the senior secured leverage ratio to measure our ability to meet our obligations on our senior secured debt by
comparing the total amount of such debt to our Adjusted EBITDA, which our lenders use to estimate our cash flow
from operations. The senior secured leverage ratio is calculated as the ratio of senior secured indebtedness to
Adjusted EBITDA, as defined by our senior secured credit facility. For the twelve months ended December 31,
2007, our senior secured leverage ratio was 2.10 to 1.0, which means for every $1.00 of Adjusted EBITDA we had
$2.10 of senior secured indebtedness. In addition, consolidated Adjusted EBITDA is also utilized, among other
measures, to determine management’ s compensation levels. Adjusted EBITDA is not a measure calculated in
accordance with GAAP, and should not be considered a substitute for, operating income (loss), net income (loss), or
any other measure of financial performance reported in accordance with GAAP. In addition, Adjusted EBITDA
should not be construed as an alternative to, or more meaningful than cash flows from operating activities, as
determined in accordance with GAAP.