Metro PCS 2007 Annual Report Download - page 16
Download and view the complete annual report
Please find page 16 of the 2007 Metro PCS annual report below. You can navigate through the pages in the report by either clicking on the pages listed below, or by using the keyword search tool below to find specific information within the annual report.
5
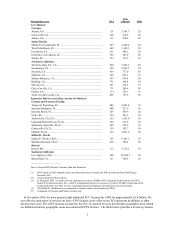
Metropolitan Area
BTA
POPs
(‘000s)(1)
MHz
Core Markets:
Georgia:
Atlanta, GA ........................................................................................ 24 5,345.7 20
Gainesville, GA ................................................................................. 160 314.5 30
Athens, GA......................................................................................... 22 236.0 20
South Florida:
Miami-Fort Lauderdale, FL................................................................ 293 4,490.4 30
West Palm Beach, FL......................................................................... 469 1,362.3 30
Fort Myers, FL ................................................................................... 151 768.1 30
Fort Pierce-Vero Beach, FL ............................................................... 152 507.9 30
Naples, FL.......................................................................................... 313 333.9 30
Northern California:
San Fran.-Oak.-S.J., CA..................................................................... 404 7,544.2 20
Sacramento, CA ................................................................................. 389 2,451.3 30
Stockton, CA...................................................................................... 434 777.0 30
Modesto, CA ...................................................................................... 303 621.1 15
Salinas-Monterey, CA........................................................................ 397 439.4 30
Redding, CA....................................................................................... 371 308.8 30
Merced, CA........................................................................................ 291 276.2 15
Chico-Oroville, CA ............................................................................ 79 249.6 30
Eureka, CA......................................................................................... 134 156.1 15
Yuba City-Marysville, CA................................................................. 485 157.9 30
Expansion Markets (excluding Auction 66 Markets):
Central and Northern Florida:
Tampa-St. Petersburg, FL .................................................................. 440 2,961.4 10
Sarasota-Bradenton, FL...................................................................... 408 721.9 10
Daytona Beach, FL............................................................................. 107 569.9 20
Ocala, FL............................................................................................ 326 303.2 10
Jacksonville, FL(2)(3) ........................................................................ 212 1,553.0 10
Lakeland-Winter Haven, FL(2).......................................................... 239 531.8 10
Melbourne-Titusville, FL(2) .............................................................. 289 538.9 10
Gainesville, FL(2).............................................................................. 159 342.7 10
Orlando, FL(2) ................................................................................... 336 2,061.0 10
Dallas/Ft. Worth
Dallas/Ft. Worth, TX(4) ..................................................................... 101 6,183.2 10
Sherman-Denison, TX(5) ................................................................... 418 154.4 10
Detroit:
Detroit, MI ......................................................................................... 112 5,116.2 10
Southern California:
Los Angeles, CA(2) ........................................................................... 262 18,564.1 10
Bakersfield, CA.................................................................................. 28 766.6 10
_____________________
Source: Kagan 2005 Wireless Telecom Atlas and Databook.
(1) POPs based on 2005 population data and increased based on annualized POP growth rates from 2005 Kagan
Research, LLC.
(2) License granted to Royal Street.
(3) In December 2007, we entered into an agreement to acquire 10 MHz of PCS spectrum for the Jacksonville BTA
from PTA Communications, Inc., which if consummated will give us access to a total of 20 MHz of spectrum in the
Jacksonville BTA. See Note 6 to the consolidated financial statements included elsewhere in this report.
(4) The Dallas/Ft. Worth license is comprised of certain counties which make up CMA9.
(5) Comprised of Grayson and Fannin counties only.
In November 2006, we were granted eight additional FCC licenses for AWS for approximately $1.4 billion. We
can offer the same types of services on these AWS licenses as we offer on our PCS spectrum in addition to other
advanced services. The AWS licenses awarded by the FCC in Auction 66 were divided into geographic areas which
are different from the geographic areas associated with PCS licenses. The table below provides a license by license


