Metro PCS 2007 Annual Report Download - page 142
Download and view the complete annual report
Please find page 142 of the 2007 Metro PCS annual report below. You can navigate through the pages in the report by either clicking on the pages listed below, or by using the keyword search tool below to find specific information within the annual report.-
 1
1 -
2
-
3
-
4
-
5
-
6
-
7
-
8
-
9
-
10
-
11
-
12
-
13
-
14
-
15
-
16
-
17
-
18
-
19
-
20
-
21
-
22
-
23
-
24
-
25
-
26
-
27
-
28
-
29
-
30
-
31
-
32
-
33
-
34
-
35
-
36
-
37
-
38
-
39
-
40
-
41
-
42
-
43
-
44
-
45
-
46
-
47
-
48
-
49
-
50
-
51
-
52
-
53
-
54
-
55
-
56
-
57
-
58
-
59
-
60
-
61
-
62
-
63
-
64
-
65
-
66
-
67
-
68
-
69
-
70
-
71
-
72
-
73
-
74
-
75
-
76
-
77
-
78
-
79
-
80
-
81
-
82
-
83
-
84
-
85
-
86
-
87
-
88
-
89
-
90
-
91
-
92
-
93
-
94
-
95
-
96
-
97
-
98
-
99
-
100
-
101
-
102
-
103
-
104
-
105
-
106
-
107
-
108
-
109
-
110
-
111
-
112
-
113
-
114
-
115
-
116
-
117
-
118
-
119
-
120
-
121
-
122
-
123
-
124
-
125
-
126
-
127
-
128
-
129
-
130
-
131
-
 132
132 -
 133
133 -
 134
134 -
 135
135 -
 136
136 -
 137
137 -
 138
138 -
 139
139 -
 140
140 -
 141
141 -
 142
142 -
 143
143 -
 144
144 -
 145
145 -
 146
146 -
 147
147 -
 148
148 -
 149
149 -
 150
150 -
 151
151 -
 152
152 -
153
-
154
-
155
-
156
-
157
-
158
-
159
-
160
 |
 |

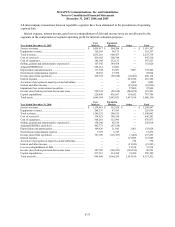
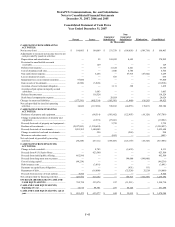
MetroPCS Communications, Inc. and Subsidiaries
Notes to Consolidated Financial Statements
December 31, 2007, 2006 and 2005
F-43
Consolidated Statement of Income
Year Ended December 31, 2006
Parent
Issuer
Guarantor
Subsidiaries
Non-Guarantor
Subsidiaries
Eliminations
Consolidated
(In thousands)
REVENUES:
Service revenues............................... $ — $ 695 $ 1,290,945 $ 1,005 $ (1,698) $ 1,290,947
Equipment revenues......................... — 11,900 244,016 — — 255,916
Total revenues ................................. — 12,595 1,534,961 1,005 (1,698) 1,546,863
OPERATING EXPENSES:
Cost of service (excluding
depreciation and amortization
expense shown separately
below) ............................................ — — 434,987 11,992 (1,698) 445,281
Cost of equipment ............................ — 11,538 465,339 — — 476,877
Selling, general and administrative
expenses (excluding depreciation
and amortization expense shown
separately below)........................... — 362 227,723 15,533 — 243,618
Depreciation and amortization......... — — 134,708 320 — 135,028
Loss on disposal of assets ................ — — 8,806 — — 8,806
Total operating expenses................. — 11,900 1,271,563 27,845 (1,698) 1,309,610
Income from operations .................... — 695 263,398 (26,480) — 237,253
OTHER EXPENSE (INCOME):
Interest expense................................ 17,161 115,575 (7,370) 30,956 (40,337) 115,985
Earnings from consolidated
subsidiaries .................................... (77,506) (214,795) — — 292,301 —
Accretion of put option in majority-
owned subsidiary ........................... — 770 — — — 770
Interest and other income................. (2,807) (57,493) (699) (882) 40,338 (21,543)
Loss (gain) on extinguishment of
debt ................................................ 9,345 42,415 (242) — — 51,518
Total other expense ......................... (53,807) (113,528) (8,311) 30,074 292,302 146,730
Income before provision for income
taxes ................................................ 53,807 114,223 271,709 (56,914) (292,302) 90,523
Provision for income taxes............... — (36,717) — — — (36,717)
Net income (loss) .............................. $ 53,807 $ 77,506 $ 271,709 $ (56,914) $ (292,302) $ 53,806