Metro PCS 2007 Annual Report Download - page 77
Download and view the complete annual report
Please find page 77 of the 2007 Metro PCS annual report below. You can navigate through the pages in the report by either clicking on the pages listed below, or by using the keyword search tool below to find specific information within the annual report.-
 1
1 -
2
-
3
-
4
-
5
-
6
-
7
-
8
-
9
-
10
-
11
-
12
-
13
-
14
-
15
-
16
-
17
-
18
-
19
-
20
-
21
-
22
-
23
-
24
-
25
-
26
-
27
-
28
-
29
-
30
-
31
-
32
-
33
-
34
-
35
-
36
-
37
-
38
-
39
-
40
-
41
-
42
-
43
-
44
-
45
-
46
-
47
-
48
-
49
-
50
-
51
-
52
-
53
-
54
-
55
-
56
-
57
-
58
-
59
-
60
-
61
-
62
-
63
-
64
-
65
-
66
-
 67
67 -
 68
68 -
 69
69 -
 70
70 -
 71
71 -
 72
72 -
 73
73 -
 74
74 -
 75
75 -
 76
76 -
 77
77 -
 78
78 -
 79
79 -
 80
80 -
 81
81 -
 82
82 -
 83
83 -
 84
84 -
 85
85 -
 86
86 -
 87
87 -
88
-
89
-
90
-
91
-
92
-
93
-
94
-
95
-
96
-
97
-
98
-
99
-
100
-
101
-
102
-
103
-
104
-
105
-
106
-
107
-
108
-
109
-
110
-
111
-
112
-
113
-
114
-
115
-
116
-
117
-
118
-
119
-
120
-
121
-
122
-
123
-
124
-
125
-
126
-
127
-
128
-
129
-
130
-
131
-
132
-
133
-
134
-
135
-
136
-
137
-
138
-
139
-
140
-
141
-
142
-
143
-
144
-
145
-
146
-
147
-
148
-
149
-
150
-
151
-
152
-
153
-
154
-
155
-
156
-
157
-
158
-
159
-
160
 |
 |

66
are placed into service. We expect capitalized interest to be significant during the construction of our additional
Expansion Markets and related network assets.
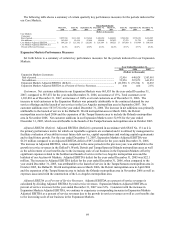
Provision for Income Taxes. Income tax expense for the year ended December 31, 2006 decreased to
$36.7 million, which is approximately 41% of our income before provision for income taxes. For the year ended
December 31, 2005 the provision for income taxes was $127.4 million, or approximately 39% of income before
provision for income taxes. The year ended December 31, 2005 included a gain on the sale of a 10 MHz portion of
our 30 MHz PCS license in the San Francisco-Oakland-San Jose basic trading area in the amount of $228.2 million.
Net Income. Net income decreased $144.9 million, or 73%, to $53.8 million for the year ended December 31,
2006 compared to $198.7 million for the year ended December 31, 2005. The significant decrease is primarily
attributable to our non-recurring sale of a 10 MHz portion of our 30 MHz PCS license in the San Francisco-
Oakland-San Jose basic trading area in May 2005 for cash consideration of $230.0 million. The sale of PCS
spectrum resulted in a gain on disposal of asset in the amount of $139.2 million, net of income taxes. Net income for
the year ended December 31, 2006, excluding the tax effected impact of the gain on the sale of the PCS license,
decreased approximately 10%. The decrease in net income, excluding the tax effected impact of the gain on the sale
of spectrum, is primarily due to the increase in operating losses in our Expansion Markets.
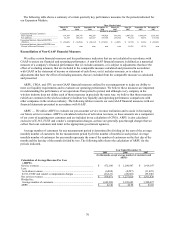
Performance Measures
In managing our business and assessing our financial performance, we supplement the information provided by
financial statement measures with several customer-focused performance metrics that are widely used in the
wireless industry. These metrics include average revenue per user per month, or ARPU, which measures service
revenue per customer; cost per gross customer addition, or CPGA, which measures the average cost of acquiring a
new customer; cost per user per month, or CPU, which measures the non-selling cash cost of operating our business
on a per customer basis; and churn, which measures turnover in our customer base. For a reconciliation of Non-
GAAP performance measures and a further discussion of the measures, please read “— Reconciliation of Non-
GAAP Financial Measures” below.
The following table shows annual metric information for 2005, 2006 and 2007.
Year Ended December 31,
2005 2006 2007
Customers:
End of period ..........................................................................................................
.
1,924,621 2,940,986 3,962,786
Net additions...........................................................................................................
.
525,889 1,016,365 1,021,800
Churn:
Average monthly rate..............................................................................................
.
5.1% 4.6% 4.7%
ARPU ......................................................................................................................
.
$ 42.40 $ 42.98 $ 43.03
CPGA ......................................................................................................................
.
$ 102.70 $ 117.58 $ 124.16
CPU .........................................................................................................................
.
$ 19.57 $ 19.65 $ 18.33
Customers. Net customer additions were 1,021,800 for the year ended December 31, 2007, compared to
1,016,365 for the year ended December 31, 2006. Total customers were 3,962,786 as of December 31, 2007, an
increase of 35% over the customer total as of December 31, 2006. The increase in total customers is primarily
attributable to the continued demand for our service offerings and the launch of our services in the Los Angeles
metropolitan area in September 2007. Net customer additions were 1,016,365 for the year ended December 31,
2006, compared to 525,889 for the year ended December 31, 2005, an increase of 93%. Total customers were
2,940,986 as of December 31, 2006, an increase of 53% over the customer total as of December 31, 2005. The
increase in total customers is largely attributable to the continued demand for our service offerings and the launch of
our services in the Dallas/Ft. Worth metropolitan area in March 2006 and the Detroit metropolitan area in April
2006.
Churn. As we do not require a long-term service contract, our churn percentage is expected to be higher than
traditional wireless carriers that require customers to sign a one- to two-year contract with significant early
termination fees. Average monthly churn represents (a) the number of customers who have been disconnected from
our system during the measurement period less the number of customers who have reactivated service, divided by
(b) the sum of the average monthly number of customers during such period. We classify delinquent customers as
churn after they have been delinquent for 30 days. In addition, when an existing customer establishes a new account
in connection with the purchase of an upgraded or replacement phone and does not identify themselves as an