Metro PCS 2007 Annual Report Download - page 71
Download and view the complete annual report
Please find page 71 of the 2007 Metro PCS annual report below. You can navigate through the pages in the report by either clicking on the pages listed below, or by using the keyword search tool below to find specific information within the annual report.-
 1
1 -
2
-
3
-
4
-
5
-
6
-
7
-
8
-
9
-
10
-
11
-
12
-
13
-
14
-
15
-
16
-
17
-
18
-
19
-
20
-
21
-
22
-
23
-
24
-
25
-
26
-
27
-
28
-
29
-
30
-
31
-
32
-
33
-
34
-
35
-
36
-
37
-
38
-
39
-
40
-
41
-
42
-
43
-
44
-
45
-
46
-
47
-
48
-
49
-
50
-
51
-
52
-
53
-
54
-
55
-
56
-
57
-
58
-
59
-
60
-
 61
61 -
 62
62 -
 63
63 -
 64
64 -
 65
65 -
 66
66 -
 67
67 -
 68
68 -
 69
69 -
 70
70 -
 71
71 -
 72
72 -
 73
73 -
 74
74 -
 75
75 -
 76
76 -
 77
77 -
 78
78 -
 79
79 -
 80
80 -
 81
81 -
82
-
83
-
84
-
85
-
86
-
87
-
88
-
89
-
90
-
91
-
92
-
93
-
94
-
95
-
96
-
97
-
98
-
99
-
100
-
101
-
102
-
103
-
104
-
105
-
106
-
107
-
108
-
109
-
110
-
111
-
112
-
113
-
114
-
115
-
116
-
117
-
118
-
119
-
120
-
121
-
122
-
123
-
124
-
125
-
126
-
127
-
128
-
129
-
130
-
131
-
132
-
133
-
134
-
135
-
136
-
137
-
138
-
139
-
140
-
141
-
142
-
143
-
144
-
145
-
146
-
147
-
148
-
149
-
150
-
151
-
152
-
153
-
154
-
155
-
156
-
157
-
158
-
159
-
160
 |
 |

60
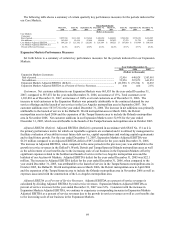
Depreciation and Amortization. Depreciation and amortization expense increased $43.2 million, or 32%, to
$178.2 million for the year ended December 31, 2007 from $135.0 million for the year ended December 31, 2006.
The increase is primarily due to increases in Core Markets and Expansion Markets depreciation expense as follows:
• Core Markets. Core Markets depreciation and amortization expense increased $7.7 million, or 7%, to $117.3
million for the year ended December 31, 2007 from $109.6 million for the year ended December 31, 2006.
The increase related primarily to an increase in network infrastructure assets placed into service during the
year ended December 31, 2007.
• Expansion Markets. Expansion Markets depreciation and amortization expense increased $31.9 million, or
145%, to $53.8 million for the year ended December 31, 2007 from $21.9 million for the year ended
December 31, 2006. The increase related primarily to an increase in network infrastructure assets placed into
service during the year ended December 31, 2007 which was significantly impacted by the launch of service
in the Los Angeles metropolitan area in September 2007.
Stock-Based Compensation Expense. Stock-based compensation expense increased $13.5 million, or 94%, to
$28.0 million for the year ended December 31, 2007 from $14.5 million for the year ended December 31, 2006. The
increase is due primarily to increases in Core Markets and Expansion Markets stock-based compensation expense as
follows:
• Core Markets. Core Markets stock-based compensation expense increased $2.9 million, or 38%, to $10.6
million for the year ended December 31, 2007 from $7.7 million for the year ended December 31, 2006. The
increase is primarily related to an increase in stock options granted to employees in these markets throughout
the year ended December 31, 2007.
• Expansion Markets. Expansion Markets stock-based compensation expense increased $10.6 million, or
158%, to $17.4 million for the year ended December 31, 2007 from $6.8 million for the year ended
December 31, 2006. The increase is primarily related to an increase in stock options granted to employees in
these markets throughout the year ended December 31, 2007.
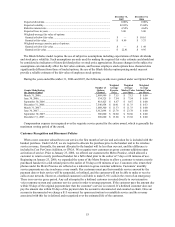
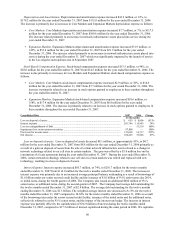
Consolidated Data 2007 2006 Change
(in thousands)
Loss on disposal of assets ................................................................................................................ $ 655 $ 8,806 (93)%
Interest expense ............................................................................................................................... 201,746 115,985 74%
Loss on extinguishment of debt ....................................................................................................... — 51,518 100%
Impairment loss on investment securities ........................................................................................ 97,800
— 100%
Provision for income taxes............................................................................................................... 123,098 36,717 235%
Net income....................................................................................................................................... 100,403 53,806 87%
Loss on disposal of assets. Loss on disposal of assets decreased $8.1 million, or approximately 93%, to $0.7
million for the year ended December 31, 2007 from $8.8 million for the year ended December 31, 2006 primarily as
a result of a gain on disposal of assets from the sale of certain network infrastructure assets related to a change in
network technology related to our cell sites in certain markets. The gain was offset by a $3.0 million loss on the
termination of a lease agreement during the year ended December 31, 2007. During the year ended December 31,
2006, certain network technology related to our cell sites in certain markets was retired and replaced with new
technology, resulting in a loss on disposal of assets.
Interest Expense. Interest expense increased $85.7 million, or 74%, to $201.7 million for the twelve months
ended December 31, 2007 from $116.0 million for the twelve months ended December 31, 2006. The increase in
interest expense was primarily due to an increased average principal balance outstanding as a result of borrowings of
$1.6 billion under our senior secured credit facility and the issuance of $1.0 billion of 9¼% senior notes due 2014,
or initial notes, during the fourth quarter of 2006. The Company also issued an additional $400 million of 9¼%
senior notes, or additional notes, during the second quarter of 2007. The Company had average debt outstanding for
the twelve months ended December 31, 2007 of $2.8 billion. The average debt outstanding for the twelve months
ending December 31, 2006 was $1.3 billion. The weighted average interest rate decreased to 8.15% for the twelve
months ended December 31, 2007 compared to 10.30% for the twelve months ended December 31, 2006 as a result
of the borrowing rates under the senior secured credit facility, issuance of the initial notes and the additional notes,
collectively referred to as the 9¼% senior notes, and the impact of the interest rate hedge. The increase in interest
expense was partially offset by the capitalization of $34.9 million of interest during the twelve months ended
December 31, 2007, compared to $17.5 million of interest capitalized during the same period in 2006. We capitalize