Metro PCS 2007 Annual Report Download - page 58
Download and view the complete annual report
Please find page 58 of the 2007 Metro PCS annual report below. You can navigate through the pages in the report by either clicking on the pages listed below, or by using the keyword search tool below to find specific information within the annual report.-
 1
1 -
2
-
3
-
4
-
5
-
6
-
7
-
8
-
9
-
10
-
11
-
12
-
13
-
14
-
15
-
16
-
17
-
18
-
19
-
20
-
21
-
22
-
23
-
24
-
25
-
26
-
27
-
28
-
29
-
30
-
31
-
32
-
33
-
34
-
35
-
36
-
37
-
38
-
39
-
40
-
41
-
42
-
43
-
44
-
45
-
46
-
47
-
 48
48 -
 49
49 -
 50
50 -
 51
51 -
 52
52 -
 53
53 -
 54
54 -
 55
55 -
 56
56 -
 57
57 -
 58
58 -
 59
59 -
 60
60 -
 61
61 -
 62
62 -
 63
63 -
 64
64 -
 65
65 -
 66
66 -
 67
67 -
 68
68 -
69
-
70
-
71
-
72
-
73
-
74
-
75
-
76
-
77
-
78
-
79
-
80
-
81
-
82
-
83
-
84
-
85
-
86
-
87
-
88
-
89
-
90
-
91
-
92
-
93
-
94
-
95
-
96
-
97
-
98
-
99
-
100
-
101
-
102
-
103
-
104
-
105
-
106
-
107
-
108
-
109
-
110
-
111
-
112
-
113
-
114
-
115
-
116
-
117
-
118
-
119
-
120
-
121
-
122
-
123
-
124
-
125
-
126
-
127
-
128
-
129
-
130
-
131
-
132
-
133
-
134
-
135
-
136
-
137
-
138
-
139
-
140
-
141
-
142
-
143
-
144
-
145
-
146
-
147
-
148
-
149
-
150
-
151
-
152
-
153
-
154
-
155
-
156
-
157
-
158
-
159
-
160
 |
 |

47
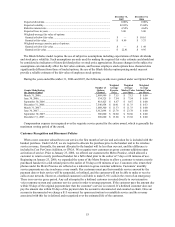
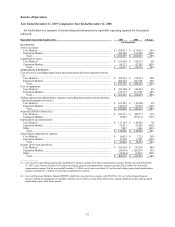
As of December 31,
2003 2004 2005 2006 2007
(In Thousands)
Balance Sheet Data:
Cash, cash equivalents & short-term investments ........................................................... $ 254,838 $ 59,441 $ 503,131 $ 552,149 $ 1,470,208
Property and equipment, net............................................................................................. 485,032 636,368 831,490 1,256,162 1,891,411
Total assets ....................................................................................................................... 898,939 965,396 2,158,981 4,153,122 5,806,130
Long-term debt (including current maturities)................................................................. 195,755 184,999 905,554 2,596,000 3,002,177
Series D Cumulative Convertible Redeemable Participating Preferred Stock................ 378,926 400,410 421,889 443,368 —
Series E Cumulative Convertible Redeemable Participating Preferred Stock ................ — — 47,796 51,135 —
Stockholders’ equity......................................................................................................... 71,333 125,434 367,906 413,245 1,848,746
__________
(1) See Note 17 to the consolidated financial statements included elsewhere in this report for an explanation of the calculation of basic and diluted net income
(loss) per common share. The calculation of basic and diluted net income (loss) per common share for the years ended December 31, 2003 and 2004 is not
included in Note 17 to the consolidated financial statements.
Item 7. Management’s Discussion and Analysis of Financial Condition and Results of Operations
Company Overview
Except as expressly stated, the financial condition and results of operations discussed throughout Management’ s
Discussion and Analysis of Financial Condition and Results of Operations are those of MetroPCS Communications,
Inc. and its consolidated subsidiaries, including MetroPCS Wireless, Inc. and Royal Street Communications, LLC.
References to “MetroPCS,” “MetroPCS Communications,” “our Company,” “the Company,” “we,” “our,” “ours”
and “us” refer to MetroPCS Communications, Inc., a Delaware corporation, and its wholly-owned subsidiaries.
Unless otherwise indicated, all share numbers and per share prices give effect to a 3 for 1 stock split effected by
means of a stock dividend of two shares of common stock for each share of common stock issued and outstanding at
the close of business on March 14, 2007. On April 18, 2007, the registration statement for our initial public offering
became effective and our common stock began trading on the New York Stock Exchange under the symbol “PCS”
on April 19, 2007. We consummated our initial public offering of our common stock on April 24, 2007.
We are a wireless telecommunications carrier that currently offers wireless broadband personal communication
services, or PCS, primarily in the greater Atlanta, Dallas/Ft. Worth, Detroit, Los Angeles, Miami, San Francisco,
Sacramento and Tampa/Sarasota/Orlando metropolitan areas. We launched service in the greater Atlanta, Miami and
Sacramento metropolitan areas in the first quarter of 2002; in San Francisco in September 2002; in Tampa/Sarasota
in October 2005; in Dallas/Ft. Worth in March 2006; in Detroit in April 2006; in Orlando in November 2006; and in
Los Angeles in September 2007. In 2005, Royal Street Communications, LLC, or Royal Street Communications,
and with its wholly-owned subsidiaries (collectively, “Royal Street”), was granted licenses by the Federal
Communications Commission, or FCC, in Los Angeles and various metropolitan areas throughout northern Florida.
We own 85% of the limited liability company member interests in Royal Street and we have a wholesale
arrangement with Royal Street under which we purchase up to 85% of the engineered capacity of Royal Street’ s
systems allowing us to sell our standard products and services under the MetroPCS brand to the public. Royal Street
has constructed or is in the process of constructing its network infrastructure in its licensed metropolitan areas. We
commenced commercial services in Orlando and certain portions of northern Florida in November 2006, and in Los
Angeles in September 2007 through our arrangements with Royal Street.
As a result of the significant growth we have experienced since we launched operations, our results of operations
to date are not necessarily indicative of the results that can be expected in future periods. Moreover, we expect that
our number of customers will continue to increase, which will continue to contribute to increases in our revenues
and operating expenses. In November 2006, we were granted advanced wireless services, or AWS, licenses
currently covering a total population of approximately 126 million outside of where we then held or had access to
spectrum for an aggregate purchase price of approximately $1.4 billion. Approximately 84 million of the total
licensed population associated with our Auction 66 licenses represents expansion opportunities in geographic areas
outside of our current operating markets, which we refer to as our Auction 66 Markets. These new expansion
opportunities in our Auction 66 Markets cover six of the 25 largest metropolitan areas in the United States. The
balance of our Auction 66 Markets, which currently cover a population of approximately 42 million, supplements or
expands the geographic boundaries of our and Royal Street’ s existing operations in Dallas/Ft. Worth, Detroit, Los
Angeles, San Francisco and Sacramento. We currently plan to focus on building out approximately 40 million of the
total population in our Auction 66 Markets with a primary focus on the New York, Philadelphia, Boston and Las
Vegas metropolitan areas. Of the approximate 40 million total population, we are targeting launch of operations with
an initial covered population of approximately 30 to 32 million by late 2008 through the first half of 2009. Our