Metro PCS 2007 Annual Report Download - page 87
Download and view the complete annual report
Please find page 87 of the 2007 Metro PCS annual report below. You can navigate through the pages in the report by either clicking on the pages listed below, or by using the keyword search tool below to find specific information within the annual report.-
 1
1 -
2
-
3
-
4
-
5
-
6
-
7
-
8
-
9
-
10
-
11
-
12
-
13
-
14
-
15
-
16
-
17
-
18
-
19
-
20
-
21
-
22
-
23
-
24
-
25
-
26
-
27
-
28
-
29
-
30
-
31
-
32
-
33
-
34
-
35
-
36
-
37
-
38
-
39
-
40
-
41
-
42
-
43
-
44
-
45
-
46
-
47
-
48
-
49
-
50
-
51
-
52
-
53
-
54
-
55
-
56
-
57
-
58
-
59
-
60
-
61
-
62
-
63
-
64
-
65
-
66
-
67
-
68
-
69
-
70
-
71
-
72
-
73
-
74
-
75
-
76
-
 77
77 -
 78
78 -
 79
79 -
 80
80 -
 81
81 -
 82
82 -
 83
83 -
 84
84 -
 85
85 -
 86
86 -
 87
87 -
 88
88 -
 89
89 -
 90
90 -
 91
91 -
 92
92 -
 93
93 -
 94
94 -
 95
95 -
 96
96 -
 97
97 -
98
-
99
-
100
-
101
-
102
-
103
-
104
-
105
-
106
-
107
-
108
-
109
-
110
-
111
-
112
-
113
-
114
-
115
-
116
-
117
-
118
-
119
-
120
-
121
-
122
-
123
-
124
-
125
-
126
-
127
-
128
-
129
-
130
-
131
-
132
-
133
-
134
-
135
-
136
-
137
-
138
-
139
-
140
-
141
-
142
-
143
-
144
-
145
-
146
-
147
-
148
-
149
-
150
-
151
-
152
-
153
-
154
-
155
-
156
-
157
-
158
-
159
-
160
 |
 |

76
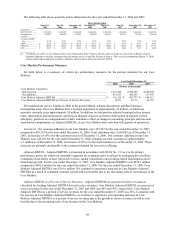
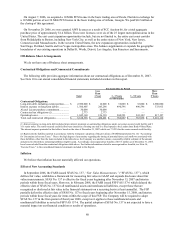
The following table shows the calculation of our consolidated Adjusted EBITDA, as defined in our senior secured
credit facility, for the years ended December 31, 2005, 2006 and 2007.
Year Ended December 31,
2005 2006 2007
(In Thousands)
Calculation of Consolidated Adjusted EBITDA:
Net income............................................................................................................ $ 198,677 $ 53,806 $ 100,403
Adjustments:
Depreciation and amortization............................................................................. 87,895 135,028 178,202
(Gain) loss on disposal of assets .......................................................................... (218,203) 8,806 655
Stock-based compensation expense(1) ................................................................ 2,596 14,472 28,024
Interest expense ................................................................................................... 58,033 115,985 201,746
Accretion of put option in majority-owned subsidiary(1).................................... 252 770 1,003
Interest and other income..................................................................................... (8,658) (21,543) (63,936)
Loss on extinguishment of debt ........................................................................... 46,448 51,518 —
Impairment loss on investment securities ........................................................... — — 97,800
Provision for income taxes................................................................................... 127,425 36,717 123,098
Consolidated Adjusted EBITDA ....................................................................... $ 294,465 $ 395,559 $ 666,995
__________
(1) Represents a non-cash expense, as defined by our senior secured credit facility.
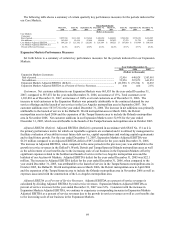
In addition, for further information, the following table reconciles consolidated Adjusted EBITDA, as defined in
our senior secured credit facility, to cash flows from operating activities for the years ended December 31, 2005,
2006 and 2007.
Year Ended December 31,
2005 2006 2007
(In Thousands)
Reconciliation of Net Cash Provided by Operating Activities to
Consolidated Adjusted EBITDA:
Net cash provided by operating activities ............................................................. $ 283,216 $ 364,761 $ 589,306
Adjustments:
Interest expense ................................................................................................... 58,033 115,985 201,746
Non-cash interest expense.................................................................................... (4,285) (6,964) (3,259)
Interest and other income..................................................................................... (8,658) (21,543) (63,936)
Provision for uncollectible accounts receivable................................................... (129) (31) (129)
Deferred rent expense.......................................................................................... (4,407) (7,464) (13,745)
Cost of abandoned cell sites................................................................................. (725) (3,783) (6,704)
Accretion of asset retirement obligation .............................................................. (423) (769) (1,439)
Gain on sale of investments................................................................................. 190 2,385 10,506
Provision for income taxes................................................................................... 127,425 36,717 123,098
Deferred income taxes ......................................................................................... (125,055) (32,341) (118,524)
Changes in working capital.................................................................................. (30,717) (51,394) (49,925)
Consolidated Adjusted EBITDA ....................................................................... $ 294,465 $ 395,559 $ 666,995
Operating Activities
Cash provided by operating activities was $589.3 million during the year ended December 31, 2007 compared to
$364.8 million for the year ended December 31, 2006. The increase was primarily attributable to a 87% increase in
net income as well as a 266% increase in deferred income taxes during the year ended December 31, 2007 compared
to the year ended December 31, 2006.
Cash provided by operating activities was $364.8 million during the year ended December 31, 2006 compared to
$283.2 million for the year ended December 31, 2005. The increase was primarily attributable to the timing of
payments on accounts payable and accrued expenses for the year ended December 31, 2006 as well as an increase in
deferred revenues due to an approximately 53% increase in customers during the year ended December 31, 2006
compared to the year ended December 31, 2005.
Cash provided by operating activities was $283.2 million during the year ended December 31, 2005 compared to
cash provided by operating activities of $150.4 million during the year ended December 31, 2004. The increase was
primarily attributable to a significant increase in net income, including a $228.2 million gain on the sale of a
10 MHz portion of our 30MHz PCS license for the San Francisco — Oakland — San Jose basic trading area, and
the timing of payments on accounts payable and accrued expenses in the year ended December 31, 2005, partially
offset by interest payments on the first and second lien credit agreements that were executed in May 2005.