Metro PCS 2007 Annual Report Download - page 146
Download and view the complete annual report
Please find page 146 of the 2007 Metro PCS annual report below. You can navigate through the pages in the report by either clicking on the pages listed below, or by using the keyword search tool below to find specific information within the annual report.-
 1
1 -
2
-
3
-
4
-
5
-
6
-
7
-
8
-
9
-
10
-
11
-
12
-
13
-
14
-
15
-
16
-
17
-
18
-
19
-
20
-
21
-
22
-
23
-
24
-
25
-
26
-
27
-
28
-
29
-
30
-
31
-
32
-
33
-
34
-
35
-
36
-
37
-
38
-
39
-
40
-
41
-
42
-
43
-
44
-
45
-
46
-
47
-
48
-
49
-
50
-
51
-
52
-
53
-
54
-
55
-
56
-
57
-
58
-
59
-
60
-
61
-
62
-
63
-
64
-
65
-
66
-
67
-
68
-
69
-
70
-
71
-
72
-
73
-
74
-
75
-
76
-
77
-
78
-
79
-
80
-
81
-
82
-
83
-
84
-
85
-
86
-
87
-
88
-
89
-
90
-
91
-
92
-
93
-
94
-
95
-
96
-
97
-
98
-
99
-
100
-
101
-
102
-
103
-
104
-
105
-
106
-
107
-
108
-
109
-
110
-
111
-
112
-
113
-
114
-
115
-
116
-
117
-
118
-
119
-
120
-
121
-
122
-
123
-
124
-
125
-
126
-
127
-
128
-
129
-
130
-
131
-
132
-
133
-
134
-
135
-
 136
136 -
 137
137 -
 138
138 -
 139
139 -
 140
140 -
 141
141 -
 142
142 -
 143
143 -
 144
144 -
 145
145 -
 146
146 -
 147
147 -
 148
148 -
 149
149 -
 150
150 -
 151
151 -
 152
152 -
 153
153 -
 154
154 -
 155
155 -
 156
156 -
157
-
158
-
159
-
160
 |
 |

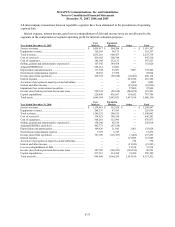
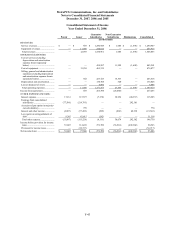
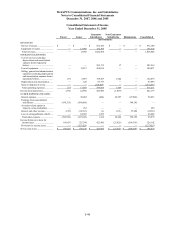
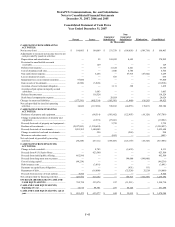
MetroPCS Communications, Inc. and Subsidiaries
Notes to Consolidated Financial Statements
December 31, 2007, 2006 and 2005
F-47
Consolidated Statement of Cash Flows
Year Ended December 31, 2005
Parent
Issuer
Guarantor
Subsidiaries
Non-Guarantor
Subsidiaries
Eliminations
Consolidated
(In Thousands)
CASH FLOWS FROM
OPERATING ACTIVITIES:
Net income (loss) ................................ $ 198,928 $ 198,587 $ 423,986 $ (27,925) $ (594,899) $ 198,677
Adjustments to reconcile net income
(loss) to net cash (used in) provided
by operating activities:
Depreciation and amortization........... — 120 87,775 — — 87,895
Provision for uncollectible accounts
receivable ......................................... — 129 — — — 129
Deferred rent expense ........................ — (72) 4,479 — — 4,407
Cost of abandoned cell sites............... — — 725 — — 725
Non-cash interest expense.................. — 3,695 590 26,997 (26,997) 4,285
Gain on disposal of assets .................. — — (218,203) — — (218,203)
Loss on extinguishment of debt ......... — 44,589 1,859 — — 46,448
Gain on sale of investments ............... (154) (36) — — — (190)
Accretion of asset retirement
obligation ......................................... — 1 422 — — 423
Accretion of put option in majority-
owned subsidiary ............................. — — — — 252 252
Deferred income taxes ....................... 52,882 72,173 — — — 125,055
Stock-based compensation
expense............................................. — — 2,596 — — 2,596
Changes in assets and liabilities.......... (272,868) (608,004) 13,857 862 896,870 30,717
Net cash (used in) provided by
operating activities ............................ (21,212) (288,818) 318,086 (66) 275,226 283,216
CASH FLOWS FROM
INVESTING ACTIVITIES:
Purchases of property and equipment — — (266,033) (466) — (266,499)
Change in prepaid purchases of
property and equipment ................... — — (11,800) — — (11,800)
Proceeds from sale of property and
equipment......................................... — — 146 — — 146
Purchase of investments..................... (54,262) (685,220) — — — (739,482)
Proceeds from sale of investments..... 30,225 356,219 — — — 386,444
Change in restricted cash and
investments....................................... — (121) 14 — — (107)
Purchases of FCC licenses ................. — — (235,330) (268,600) — (503,930)
Proceeds from sale of FCC
licenses ............................................. — — 230,000 — — 230,000
Net cash used in investing activities ... (24,037) (329,122) (283,003) (269,066) — (905,228)
CASH FLOWS FROM
FINANCING ACTIVITIES:
Change in book overdraft................... — (565) — — — (565)
Payment upon execution of cash flow
hedging derivative............................ — (1,899) — — — (1,899)
Proceeds from credit agreements ....... — 902,875 — — — 902,875
Proceeds from Bridge Credit
Agreements ...................................... — 540,000 — — — 540,000
Proceeds from long-term note to
parent................................................ — — — 275,226 (275,226) —
Debt issuance costs ............................ — (29,480) — — — (29,480)
Repayment of debt ............................. — (719,671) (34,991) — — (754,662)
Proceeds from repayment of
subscriptions receivable................... — 103 — — — 103
Proceeds from issuance of preferred
stock, net of issuance costs .............. 46,662 — — — — 46,662
Proceeds from exercise of stock
options and warrants ........................ 9,210 — — — — 9,210
Net cash provided by (used in)
financing activities ............................ 55,872 691,363 (34,991) 275,226 (275,226) 712,244
INCREASE IN CASH AND CASH
EQUIVALENTS.............................. 10,623 73,423 92 6,094 — 90,232
CASH AND CASH
EQUIVALENTS, beginning of
year ................................................... 1
22,349 127 — — 22,477
CASH AND CASH
EQUIVALENTS, end of year ........ $ 10,624 $ 95,772 $ 219 $ 6,094 $ — $ 112,709