MasterCard 2012 Annual Report Download - page 99
Download and view the complete annual report
Please find page 99 of the 2012 MasterCard annual report below. You can navigate through the pages in the report by either clicking on the pages listed below, or by using the keyword search tool below to find specific information within the annual report.-
 1
1 -
2
-
3
-
4
-
5
-
6
-
7
-
8
-
9
-
10
-
11
-
12
-
13
-
14
-
15
-
16
-
17
-
18
-
19
-
20
-
21
-
22
-
23
-
24
-
25
-
26
-
27
-
28
-
29
-
30
-
31
-
32
-
33
-
34
-
35
-
36
-
37
-
38
-
39
-
40
-
41
-
42
-
43
-
44
-
45
-
46
-
47
-
48
-
49
-
50
-
51
-
52
-
53
-
54
-
55
-
56
-
57
-
58
-
59
-
60
-
61
-
62
-
63
-
64
-
65
-
66
-
67
-
68
-
69
-
70
-
71
-
72
-
73
-
74
-
75
-
76
-
77
-
78
-
79
-
80
-
81
-
82
-
83
-
84
-
85
-
86
-
87
-
88
-
 89
89 -
 90
90 -
 91
91 -
 92
92 -
 93
93 -
 94
94 -
 95
95 -
 96
96 -
 97
97 -
 98
98 -
 99
99 -
 100
100 -
 101
101 -
 102
102 -
 103
103 -
 104
104 -
 105
105 -
 106
106 -
 107
107 -
 108
108 -
 109
109 -
110
-
111
-
112
-
113
-
114
-
115
-
116
-
117
-
118
-
119
-
120
-
121
-
122
-
123
-
124
-
125
-
126
-
127
-
128
-
129
-
130
-
131
-
132
-
133
-
134
-
135
-
136
-
137
-
138
-
139
-
140
-
141
-
142
-
143
-
144
 |
 |

MASTERCARD INCORPORATED
NOTES TO CONSOLIDATED FINANCIAL STATEMENTS—(Continued)
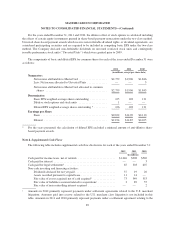
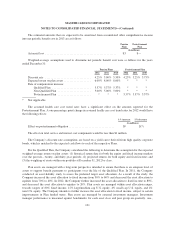
Investment Income:
Components of net investment income for each of the years ended December 31 were as follows:
2012 2011 2010
(in millions)
Interest income .............................................. $ 36 $ 44 $ 48
Investment securities available-for-sale:
Gross realized gains ...................................... 2 10 9
Gross realized losses ...................................... (1) (2) —
Total investment income, net ................................... $ 37 $ 52 $ 57
Interest income primarily consists of interest income generated from cash, cash equivalents, investment
securities available-for-sale and investment securities held-to-maturity.
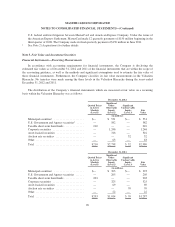
Note 6. Prepaid Expenses and Other Assets
Prepaid expenses and other current assets consisted of the following at December 31:
2012 2011
(in millions)
Customer and merchant incentives ......................................... $222 $190
Investment securities held-to-maturity ...................................... 36 —
Prepaid income taxes .................................................... 77 35
Income taxes receivable ................................................. 163 35
Other ................................................................ 183 144
Total prepaid expenses and other current assets ............................... $681 $404
Other assets consisted of the following at December 31:
2012 2011
(in millions)
Customer and merchant incentives ......................................... $404 $409
Nonmarketable equity investments ......................................... 249 160
Auction rate securities available-for-sale, at fair value .......................... 32 70
Investment securities held-to-maturity ...................................... — 36
Income taxes receivable ................................................. 72 15
Other ................................................................ 52 46
Total other assets ....................................................... $809 $736
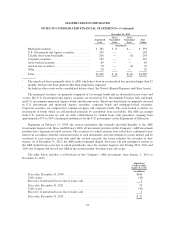
Certain customer and merchant business agreements provide incentives upon entering into the agreement.
Customer and merchant incentives represent payments made or amounts to be paid to customers and merchants
under business agreements. Amounts to be paid for these incentives and the related liability were included in
accrued expenses and other liabilities. Once the payment is made, the liability is relieved. Costs directly related
to entering into such an agreement are deferred and amortized over the life of the agreement.
Investments for which the equity method or historical cost method of accounting are used are recorded in
other assets on the consolidated balance sheet. MasterCard’s share of net earnings or losses of entities accounted
95