MasterCard 2012 Annual Report Download - page 100
Download and view the complete annual report
Please find page 100 of the 2012 MasterCard annual report below. You can navigate through the pages in the report by either clicking on the pages listed below, or by using the keyword search tool below to find specific information within the annual report.-
 1
1 -
2
-
3
-
4
-
5
-
6
-
7
-
8
-
9
-
10
-
11
-
12
-
13
-
14
-
15
-
16
-
17
-
18
-
19
-
20
-
21
-
22
-
23
-
24
-
25
-
26
-
27
-
28
-
29
-
30
-
31
-
32
-
33
-
34
-
35
-
36
-
37
-
38
-
39
-
40
-
41
-
42
-
43
-
44
-
45
-
46
-
47
-
48
-
49
-
50
-
51
-
52
-
53
-
54
-
55
-
56
-
57
-
58
-
59
-
60
-
61
-
62
-
63
-
64
-
65
-
66
-
67
-
68
-
69
-
70
-
71
-
72
-
73
-
74
-
75
-
76
-
77
-
78
-
79
-
80
-
81
-
82
-
83
-
84
-
85
-
86
-
87
-
88
-
89
-
 90
90 -
 91
91 -
 92
92 -
 93
93 -
 94
94 -
 95
95 -
 96
96 -
 97
97 -
 98
98 -
 99
99 -
 100
100 -
 101
101 -
 102
102 -
 103
103 -
 104
104 -
 105
105 -
 106
106 -
 107
107 -
 108
108 -
 109
109 -
 110
110 -
111
-
112
-
113
-
114
-
115
-
116
-
117
-
118
-
119
-
120
-
121
-
122
-
123
-
124
-
125
-
126
-
127
-
128
-
129
-
130
-
131
-
132
-
133
-
134
-
135
-
136
-
137
-
138
-
139
-
140
-
141
-
142
-
143
-
144
 |
 |

MASTERCARD INCORPORATED
NOTES TO CONSOLIDATED FINANCIAL STATEMENTS—(Continued)
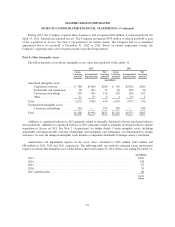
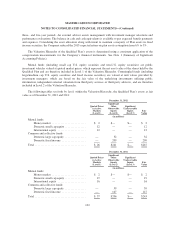
for under the equity method of accounting is included in other income (expense) on the consolidated statement of
operations. The Company accounts for nonmarketable equity investments under the historical cost method of
accounting when those investments do not qualify for the equity method of accounting. The increase in
nonmarketable equity investments is primarily due to two additional investments made in 2012.
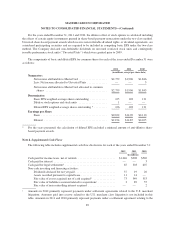
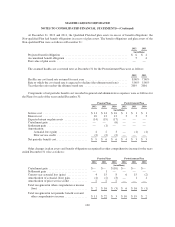
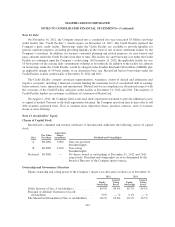
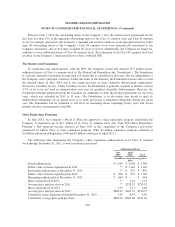
Note 7. Property, Plant and Equipment
Property, plant and equipment consisted of the following at December 31:
2012 2011
(in millions)
Building and land ..................................................... $419 $413
Equipment ........................................................... 314 298
Furniture and fixtures .................................................. 54 53
Leasehold improvements ............................................... 71 55
Property, plant and equipment ........................................... 858 819
Less accumulated depreciation and amortization ............................. (386) (370)
Property, plant and equipment, net ........................................ $472 $449
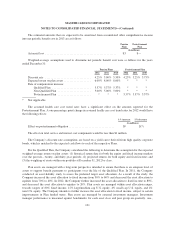
Effective March 1, 2009, MasterCard executed a ten-year lease between MasterCard, as tenant, and the
Missouri Development Finance Board (“MDFB”), as landlord, for MasterCard’s global technology and
operations center located in O’Fallon, Missouri. This lease includes a bargain purchase option and is thus
classified as a capital lease. The building and land assets and capital lease obligation were recorded at
$154 million which represented the lesser of the present value of the minimum lease payments and the fair value
of the building and land assets at the inception of the lease. The Company received refunding revenue bonds
issued by MDFB in the same amount, $154 million, with the same payment terms as the capital lease and which
contain the legal right of offset with the capital lease. The Company has netted its investment in the MDFB
refunding revenue bonds and the corresponding capital lease obligation in the consolidated balance sheet. The
related leasehold improvements will continue to be amortized over the economic life of the improvements.
As of December 31, 2012 and 2011, capital leases, excluding the capital lease noted above, of $23 million
and $21 million, respectively, were included in equipment. Accumulated amortization of these capital leases was
$10 million as of December 31, 2012 and 2011.
Depreciation expense for the above property, plant and equipment, including amortization for capital leases,
was $84 million, $77 million and $70 million for the years ended December 31, 2012, 2011 and 2010,
respectively.
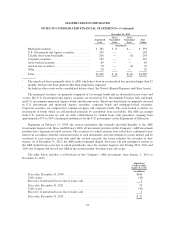
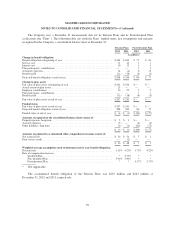
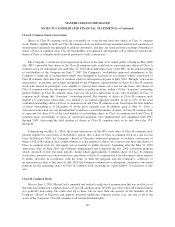
Note 8. Goodwill
The changes in the carrying amount of goodwill for the years ended December 31, 2012 and 2011 were as
follows:
2012 2011
(in millions)
Beginning balance ................................................... $1,014 $ 677
Goodwill acquired during the year ...................................... 48 354
Foreign currency translation ........................................... 30 (17)
Ending balance ..................................................... $1,092 $1,014
96