MasterCard 2012 Annual Report Download - page 113
Download and view the complete annual report
Please find page 113 of the 2012 MasterCard annual report below. You can navigate through the pages in the report by either clicking on the pages listed below, or by using the keyword search tool below to find specific information within the annual report.-
 1
1 -
2
-
3
-
4
-
5
-
6
-
7
-
8
-
9
-
10
-
11
-
12
-
13
-
14
-
15
-
16
-
17
-
18
-
19
-
20
-
21
-
22
-
23
-
24
-
25
-
26
-
27
-
28
-
29
-
30
-
31
-
32
-
33
-
34
-
35
-
36
-
37
-
38
-
39
-
40
-
41
-
42
-
43
-
44
-
45
-
46
-
47
-
48
-
49
-
50
-
51
-
52
-
53
-
54
-
55
-
56
-
57
-
58
-
59
-
60
-
61
-
62
-
63
-
64
-
65
-
66
-
67
-
68
-
69
-
70
-
71
-
72
-
73
-
74
-
75
-
76
-
77
-
78
-
79
-
80
-
81
-
82
-
83
-
84
-
85
-
86
-
87
-
88
-
89
-
90
-
91
-
92
-
93
-
94
-
95
-
96
-
97
-
98
-
99
-
100
-
101
-
102
-
 103
103 -
 104
104 -
 105
105 -
 106
106 -
 107
107 -
 108
108 -
 109
109 -
 110
110 -
 111
111 -
 112
112 -
 113
113 -
 114
114 -
 115
115 -
 116
116 -
 117
117 -
 118
118 -
 119
119 -
 120
120 -
 121
121 -
 122
122 -
 123
123 -
124
-
125
-
126
-
127
-
128
-
129
-
130
-
131
-
132
-
133
-
134
-
135
-
136
-
137
-
138
-
139
-
140
-
141
-
142
-
143
-
144
 |
 |

MASTERCARD INCORPORATED
NOTES TO CONSOLIDATED FINANCIAL STATEMENTS—(Continued)
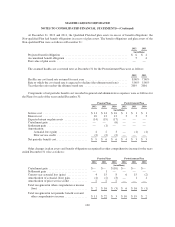
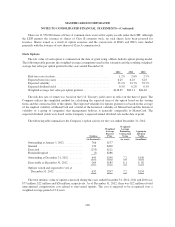
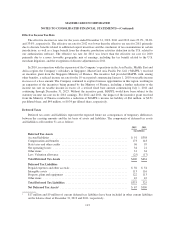
Restricted Stock Units
The following table summarizes the Company’s RSU activity for the year ended December 31, 2012:
Units
Weighted-Average
Grant-Date Fair
Value
Weighted-Average
Remaining
Contractual Term
Aggregate
Intrinsic
Value
(in thousands) (in years) (in millions)
Outstanding at January 1, 2012 . . 614 $217
Granted ..................... 165 $422
Converted ................... (215) $163
Forfeited/expired ............. (19) $273
Outstanding at December 31,
2012 ..................... 545 $298 1.2 $268
RSUs vested and expected to vest
at December 31, 2012 ........ 528 $300 1.3 $259
The fair value of each RSU is the closing stock price on the New York Stock Exchange of the Company’s
Class A common stock on the date of grant. The weighted-average grant-date fair value of RSUs granted during
the years ended December 31, 2012, 2011 and 2010 was $422, $257 and $231, respectively. Upon vesting, a
portion of the RSU award may be withheld to satisfy the minimum statutory withholding taxes. The remaining
RSUs will be settled in shares of the Company’s Class A common stock after the vesting period. The total
intrinsic value of RSUs converted into shares of Class A common stock during the years ended December 31,
2012, 2011 and 2010 was $91 million, $4 million and $234 million, respectively. As of December 31, 2012, there
was $74 million of total unrecognized compensation cost related to non-vested RSUs. The cost is expected to be
recognized over a weighted-average period of 1.8 years.
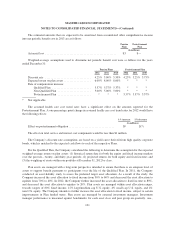
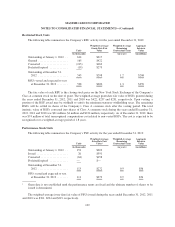
Performance Stock Units
The following table summarizes the Company’s PSU activity for the year ended December 31, 2012:
Units
Weighted-Average
Issue-Date Fair
Value1
Weighted-Average
Remaining
Contractual Term
Aggregate
Intrinsic
Value
(in thousands) (in years) (in millions)
Outstanding at January 1, 2012 . . 151 $203
Issued ...................... 26 $391
Converted ................... (64) $158
Forfeited/expired ............. — $—
Outstanding at December 31,
2012 ..................... 113 $272 0.9 $56
PSUs vested and expected to vest
at December 31, 2012 ........ 111 $272 0.9 $54
1Grant date is not established until the performance terms are fixed and the ultimate number of shares to be
issued is determined.
The weighted-average issue-date fair value of PSUs issued during the years ended December 31, 2012, 2011
and 2010 was $391, $224 and $219, respectively.
109