MasterCard 2012 Annual Report Download - page 97
Download and view the complete annual report
Please find page 97 of the 2012 MasterCard annual report below. You can navigate through the pages in the report by either clicking on the pages listed below, or by using the keyword search tool below to find specific information within the annual report.-
 1
1 -
2
-
3
-
4
-
5
-
6
-
7
-
8
-
9
-
10
-
11
-
12
-
13
-
14
-
15
-
16
-
17
-
18
-
19
-
20
-
21
-
22
-
23
-
24
-
25
-
26
-
27
-
28
-
29
-
30
-
31
-
32
-
33
-
34
-
35
-
36
-
37
-
38
-
39
-
40
-
41
-
42
-
43
-
44
-
45
-
46
-
47
-
48
-
49
-
50
-
51
-
52
-
53
-
54
-
55
-
56
-
57
-
58
-
59
-
60
-
61
-
62
-
63
-
64
-
65
-
66
-
67
-
68
-
69
-
70
-
71
-
72
-
73
-
74
-
75
-
76
-
77
-
78
-
79
-
80
-
81
-
82
-
83
-
84
-
85
-
86
-
 87
87 -
 88
88 -
 89
89 -
 90
90 -
 91
91 -
 92
92 -
 93
93 -
 94
94 -
 95
95 -
 96
96 -
 97
97 -
 98
98 -
 99
99 -
 100
100 -
 101
101 -
 102
102 -
 103
103 -
 104
104 -
 105
105 -
 106
106 -
 107
107 -
108
-
109
-
110
-
111
-
112
-
113
-
114
-
115
-
116
-
117
-
118
-
119
-
120
-
121
-
122
-
123
-
124
-
125
-
126
-
127
-
128
-
129
-
130
-
131
-
132
-
133
-
134
-
135
-
136
-
137
-
138
-
139
-
140
-
141
-
142
-
143
-
144
 |
 |

MASTERCARD INCORPORATED
NOTES TO CONSOLIDATED FINANCIAL STATEMENTS—(Continued)
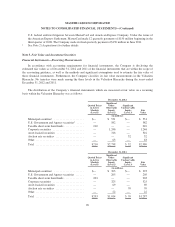
December 31, 2011
Amortized
Cost
Gross
Unrealized
Gain
Gross
Unrealized
Loss1
Fair
Value
(in millions)
Municipal securities ........................... $ 382 $ 11 $— $ 393
U.S. Government and Agency securities ........... 205 — — 205
Taxable short-term bond funds .................. 206 — (3) 203
Corporate securities ........................... 325 — — 325
Asset-backed securities ........................ 69 — — 69
Auction rate securities2........................ 78 — (8) 70
Other ...................................... 20 — — 20
Total ....................................... $1,285 $ 11 $ (11) $1,285
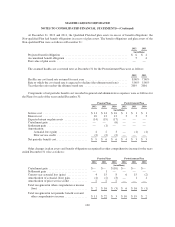
1The unrealized losses primarily relate to ARS, which have been in an unrealized loss position longer than 12
months, but have not been deemed other-than-temporarily impaired.
2Included in other assets on the consolidated balance sheet. See Note 6 (Prepaid Expenses and Other Assets).
The municipal securities are primarily comprised of tax-exempt bonds and are diversified across states and
sectors. The U.S. Government and Agency securities are invested in U.S. Government Treasury bills and bonds
and U.S. government sponsored Agency bonds and discount notes. Short-term bond funds are primarily invested
in U.S. government and sponsored Agency securities, corporate bonds and mortgage-backed securities.
Corporate securities are comprised of commercial paper and corporate bonds. The asset-backed securities are
investments in bonds which are collateralized primarily by automobile loan receivables. The ARS are exempt
from U.S. federal income tax and are fully collateralized by student loans with guarantees (ranging from
approximately 95% to 98% of principal and interest) by the U.S. government via the Department of Education.
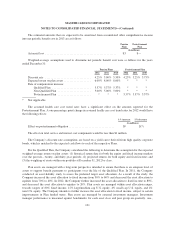
Beginning on February 11, 2008, the auction mechanism that normally provided liquidity to the ARS
investments began to fail. Since mid-February 2008, all investment positions in the Company’s ARS investment
portfolio have experienced failed auctions. The securities for which auctions have failed have continued to pay
interest in accordance with the contractual terms of such instruments and will continue to accrue interest and be
auctioned at each respective reset date until the auction succeeds, the issuer redeems the securities or they
mature. As of December 31, 2012, the ARS market remained illiquid, but issuer call and redemption activity in
the ARS student loan sector has occurred periodically since the auctions began to fail. During 2012, 2011 and
2010, the Company did not sell any ARS in the auction market, but there were calls at par.
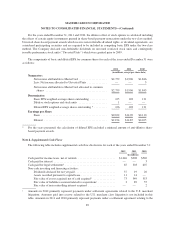
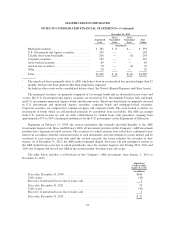
The table below includes a roll-forward of the Company’s ARS investments from January 1, 2011 to
December 31, 2012.
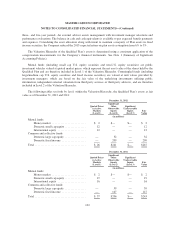
Significant
Unobservable
Inputs (Level 3)
(in millions)
Fair value, December 31, 2010 ............................................ $106
Calls, at par ........................................................... (40)
Recovery of unrealized losses due to issuer calls .............................. 4
Fair value, December 31, 2011 ............................................ 70
Calls, at par ........................................................... (42)
Recovery of unrealized losses due to issuer calls .............................. 4
Fair value, December 31, 2012 ............................................ $ 32
93