MasterCard 2012 Annual Report Download - page 60
Download and view the complete annual report
Please find page 60 of the 2012 MasterCard annual report below. You can navigate through the pages in the report by either clicking on the pages listed below, or by using the keyword search tool below to find specific information within the annual report.-
 1
1 -
2
-
3
-
4
-
5
-
6
-
7
-
8
-
9
-
10
-
11
-
12
-
13
-
14
-
15
-
16
-
17
-
18
-
19
-
20
-
21
-
22
-
23
-
24
-
25
-
26
-
27
-
28
-
29
-
30
-
31
-
32
-
33
-
34
-
35
-
36
-
37
-
38
-
39
-
40
-
41
-
42
-
43
-
44
-
45
-
46
-
47
-
48
-
49
-
 50
50 -
 51
51 -
 52
52 -
 53
53 -
 54
54 -
 55
55 -
 56
56 -
 57
57 -
 58
58 -
 59
59 -
 60
60 -
 61
61 -
 62
62 -
 63
63 -
 64
64 -
 65
65 -
 66
66 -
 67
67 -
 68
68 -
 69
69 -
 70
70 -
71
-
72
-
73
-
74
-
75
-
76
-
77
-
78
-
79
-
80
-
81
-
82
-
83
-
84
-
85
-
86
-
87
-
88
-
89
-
90
-
91
-
92
-
93
-
94
-
95
-
96
-
97
-
98
-
99
-
100
-
101
-
102
-
103
-
104
-
105
-
106
-
107
-
108
-
109
-
110
-
111
-
112
-
113
-
114
-
115
-
116
-
117
-
118
-
119
-
120
-
121
-
122
-
123
-
124
-
125
-
126
-
127
-
128
-
129
-
130
-
131
-
132
-
133
-
134
-
135
-
136
-
137
-
138
-
139
-
140
-
141
-
142
-
143
-
144
 |
 |
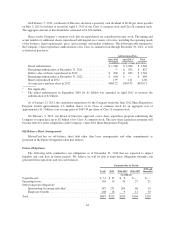
•Connectivity fees are charged to issuers and acquirers for network access, equipment and the
transmission of authorization and settlement messages. These fees are based on the size of the data
being transmitted through and the number of connections to the Company’s network.
4. Other revenues: Other revenues for other payment-related services are primarily dependent on the
nature of the products or services provided to our customers but are also impacted by other factors,
such as contractual agreements. Examples of other revenues are fees associated with the following:
•Fraud products and services used to prevent or detect fraudulent transactions. This includes warning
bulletin fees which are charged to issuers and acquirers for listing invalid or fraudulent accounts
either electronically or in paper form and for distributing this listing to merchants.
•Cardholder services fees are for benefits provided with MasterCard-branded cards, such as
insurance, telecommunications assistance for lost cards and locating ATMs.
•Consulting and research fees are primarily generated by MasterCard Advisors, the Company’s
professional advisory services group. The Company’s business agreements with certain customers
and merchants may include consulting services as an incentive.
•Program management services provided to prepaid card issuers. This primarily includes foreign
exchange margin, commissions, load fees, and ATM withdrawal fees paid by cardholders on the
sale and encashment of prepaid cards. See Note 2 (Acquisitions) to the consolidated financial
statements included in Part II, Item 8 of this Report for further discussion.
• The Company also charges for a variety of other payment-related services, including rules
compliance, account and transaction enhancement services, holograms and publications.
5. Rebates and incentives (contra-revenue): Rebates and incentives are provided to certain
MasterCard customers and are recorded as contra-revenue in the same period that revenue is earned or
performance occurs. Performance periods vary depending on the type of rebate or incentive, including
commitments to the agreement term, hurdles for volumes, transactions or issuance of new cards, launch
of new programs, or the execution of marketing programs. Rebates and incentives are calculated based
on estimated performance, the timing of new and renewed agreements and the terms of the related
business agreements.
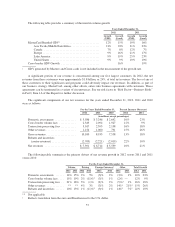
Revenue Analysis
In 2012 and 2011, gross revenues increased $1.2 billion and $1.4 billion, or 13% and 18%, respectively.
Revenue growth in 2012 and 2011 was primarily due to increased dollar volume of activity on cards carrying our
brands and increased transactions. Rebates and incentives in 2012 and 2011 increased $488 million and $202
million, or 22% and 10%, versus 2011 and 2010, respectively. Our net revenues in 2012 and 2011 increased 10%
and 21% versus 2011 and 2010, respectively.
Our revenues are primarily based on transactions and volumes, which are driven by the number of
transactions and the dollar volume of activity on cards and other devices carrying our brands. In 2012, our
processed transactions increased 25% and our GDV increased 15% on a local currency basis. In 2011, our
processed transactions increased 18% and our GDV increased 16% on a local currency basis. The acquisitions of
Access and DataCash contributed approximately 3% to our net revenue growth in 2011. There was no significant
impact on net revenue growth in 2012 from additional acquisitions. The effects of pricing actions implemented in
2012 and 2011 contributed approximately 3 and 2 percentage points to our net revenue growth for 2012 and
2011, respectively.
56