MasterCard 2012 Annual Report Download - page 62
Download and view the complete annual report
Please find page 62 of the 2012 MasterCard annual report below. You can navigate through the pages in the report by either clicking on the pages listed below, or by using the keyword search tool below to find specific information within the annual report.-
 1
1 -
2
-
3
-
4
-
5
-
6
-
7
-
8
-
9
-
10
-
11
-
12
-
13
-
14
-
15
-
16
-
17
-
18
-
19
-
20
-
21
-
22
-
23
-
24
-
25
-
26
-
27
-
28
-
29
-
30
-
31
-
32
-
33
-
34
-
35
-
36
-
37
-
38
-
39
-
40
-
41
-
42
-
43
-
44
-
45
-
46
-
47
-
48
-
49
-
50
-
51
-
 52
52 -
 53
53 -
 54
54 -
 55
55 -
 56
56 -
 57
57 -
 58
58 -
 59
59 -
 60
60 -
 61
61 -
 62
62 -
 63
63 -
 64
64 -
 65
65 -
 66
66 -
 67
67 -
 68
68 -
 69
69 -
 70
70 -
 71
71 -
 72
72 -
73
-
74
-
75
-
76
-
77
-
78
-
79
-
80
-
81
-
82
-
83
-
84
-
85
-
86
-
87
-
88
-
89
-
90
-
91
-
92
-
93
-
94
-
95
-
96
-
97
-
98
-
99
-
100
-
101
-
102
-
103
-
104
-
105
-
106
-
107
-
108
-
109
-
110
-
111
-
112
-
113
-
114
-
115
-
116
-
117
-
118
-
119
-
120
-
121
-
122
-
123
-
124
-
125
-
126
-
127
-
128
-
129
-
130
-
131
-
132
-
133
-
134
-
135
-
136
-
137
-
138
-
139
-
140
-
141
-
142
-
143
-
144
 |
 |

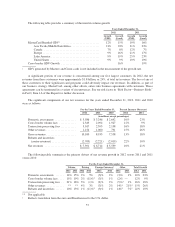
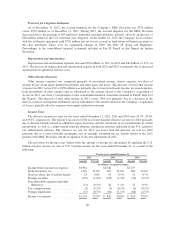
2These decreases were due to pricing changes related to the pricing structure change implemented in October
2010.
3Includes a negative 3% impact from product mix in 2012 compared to 2011.
4Other revenues were positively impacted by acquisitions (3 percentage points in 2012 and 13 percentage
points in 2011) and increased consulting fees, fraud service fees and other payment-related services in 2012
and 2011.
5Rebates and incentives, other includes the impact from new and renewed agreements and reductions from
terminated and expired agreements.
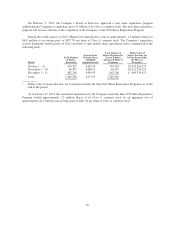
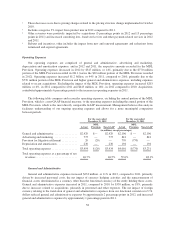
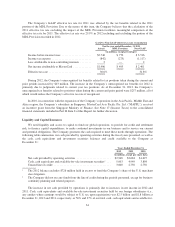
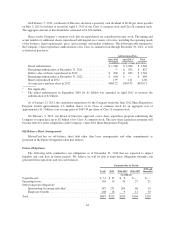
Operating Expenses
Our operating expenses are comprised of general and administrative, advertising and marketing,
depreciation and amortization expenses, and in 2012 and 2011, the respective amounts recorded for the MDL
Provision. Operating expenses decreased in 2012 by $547 million, or 14%, primarily due to the $770 million
portion of the MDL Provision recorded in 2011 (versus the $20 million portion of the MDL Provision recorded
in 2012). Operating expenses increased $1.2 billion, or 44% in 2011, compared to 2010, primarily due to the
$770 million portion of the MDL Provision and higher general and administrative expenses, including expenses
related to recent acquisitions. Excluding the impact of the MDL Provision, operating expenses increased $203
million, or 6%, in 2012 compared to 2011 and $445 million, or 16%, in 2011 compared to 2010. Acquisitions
contributed approximately 6 percentage points to the increase in operating expenses in 2011.
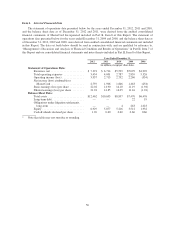
The following table compares and reconciles operating expenses, excluding the annual portion of the MDL
Provision, which is a non-GAAP financial measure, to the operating expenses including the annual portion of the
MDL Provision, which is the most directly comparable GAAP measurement. Management believes this analysis
facilitates understanding of our ongoing operating expenses and allows for a more meaningful comparison
between periods.
For the year ended
December 31, 2012
For the year ended
December 31, 2011
Actual
MDL
Provision Non-GAAP Actual
MDL
Provision Non-GAAP
(in millions, except percentages)
General and administrative ................ $2,429 $— $2,429 $2,196 $ — $2,196
Advertising and marketing ................ 775 — 775 841 — 841
Provision for litigation settlement ........... 20 (20) — 770 (770) —
Depreciation and amortizaton .............. 230 — 230 194 — 194
Total operating expenses .................. $3,454 $ (20) $3,434 $4,001 $(770) $3,231
Total operating expenses as a percentage of net
revenues ............................. 46.7% 46.5% 59.6% 48.1%
General and Administrative
General and administrative expenses increased $233 million, or 11% in 2012, compared to 2011, primarily
driven by increased personnel costs, the net impact of currency hedging activities and the remeasurement of
financial assets denominated in a currency other than the functional currency of the entity holding those assets.
General and administrative expenses increased in 2011, compared to 2010, by $339 million, or 18%, primarily
due to increases related to acquisitions, primarily in personnel and other expenses. The net impact of foreign
currency relating to the translation of general and administrative expenses from our functional currencies to U.S.
dollars reduced general and administrative expenses by approximately 2 percentage points in 2012, and increased
general and administrative expenses by approximately 1 percentage point in 2011.
58