MasterCard 2012 Annual Report Download - page 112
Download and view the complete annual report
Please find page 112 of the 2012 MasterCard annual report below. You can navigate through the pages in the report by either clicking on the pages listed below, or by using the keyword search tool below to find specific information within the annual report.-
 1
1 -
2
-
3
-
4
-
5
-
6
-
7
-
8
-
9
-
10
-
11
-
12
-
13
-
14
-
15
-
16
-
17
-
18
-
19
-
20
-
21
-
22
-
23
-
24
-
25
-
26
-
27
-
28
-
29
-
30
-
31
-
32
-
33
-
34
-
35
-
36
-
37
-
38
-
39
-
40
-
41
-
42
-
43
-
44
-
45
-
46
-
47
-
48
-
49
-
50
-
51
-
52
-
53
-
54
-
55
-
56
-
57
-
58
-
59
-
60
-
61
-
62
-
63
-
64
-
65
-
66
-
67
-
68
-
69
-
70
-
71
-
72
-
73
-
74
-
75
-
76
-
77
-
78
-
79
-
80
-
81
-
82
-
83
-
84
-
85
-
86
-
87
-
88
-
89
-
90
-
91
-
92
-
93
-
94
-
95
-
96
-
97
-
98
-
99
-
100
-
101
-
 102
102 -
 103
103 -
 104
104 -
 105
105 -
 106
106 -
 107
107 -
 108
108 -
 109
109 -
 110
110 -
 111
111 -
 112
112 -
 113
113 -
 114
114 -
 115
115 -
 116
116 -
 117
117 -
 118
118 -
 119
119 -
 120
120 -
 121
121 -
 122
122 -
123
-
124
-
125
-
126
-
127
-
128
-
129
-
130
-
131
-
132
-
133
-
134
-
135
-
136
-
137
-
138
-
139
-
140
-
141
-
142
-
143
-
144
 |
 |

MASTERCARD INCORPORATED
NOTES TO CONSOLIDATED FINANCIAL STATEMENTS—(Continued)
There are 11,550,000 shares of Class A common stock reserved for equity awards under the LTIP. Although
the LTIP permits the issuance of shares of Class B common stock, no such shares have been reserved for
issuance. Shares issued as a result of option exercises and the conversions of RSUs and PSUs were funded
primarily with the issuance of new shares of Class A common stock.
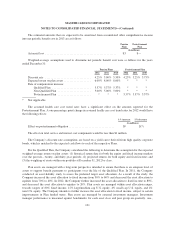
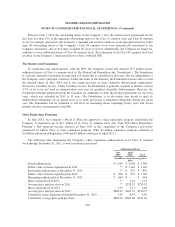
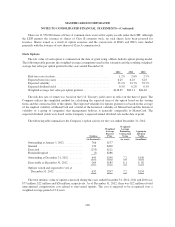
Stock Options
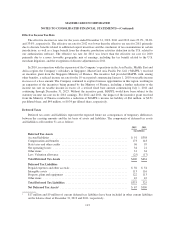
The fair value of each option is estimated on the date of grant using a Black-Scholes option pricing model.
The following table presents the weighted-average assumptions used in the valuation and the resulting weighted-
average fair value per option granted for the years ended December 31:
2012 2011 2010
Risk-free rate of return ...................................... 1.2% 2.6% 2.7%
Expected term (in years) .................................... 6.25 6.25 6.25
Expected volatility ......................................... 35.2% 33.7% 32.7%
Expected dividend yield ..................................... 0.3% 0.2% 0.3%
Weighted-average fair value per option granted .................. $148.45 $89.11 $84.62
The risk-free rate of return was based on the U.S. Treasury yield curve in effect on the date of grant. The
Company utilizes the simplified method for calculating the expected term of the option based on the vesting
terms and the contractual life of the option. The expected volatility for options granted was based on the average
of the implied volatility of MasterCard and a blend of the historical volatility of MasterCard and the historical
volatility of a group of companies that management believes is generally comparable to MasterCard. The
expected dividend yields were based on the Company’s expected annual dividend rate on the date of grant.
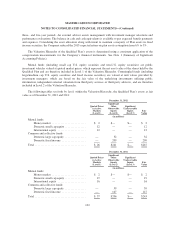
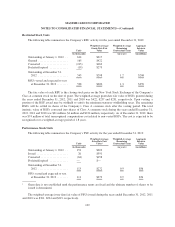
The following table summarizes the Company’s option activity for the year ended December 31, 2012:
Options
Weighted-
Average
Exercise
Price
Weighted-
Average
Remaining
Contractual
Term
Aggregate
Intrinsic
Value
(in thousands) (in years) (in millions)
Outstanding at January 1, 2012 ............ 766 $177
Granted ............................... 133 $420
Exercised .............................. (253) $121
Forfeited/expired ........................ (5) $286
Outstanding at December 31, 2012 ......... 641 $248 7.2 $156
Exercisable at December 31, 2012 .......... 269 $185 6.1 $ 82
Options vested and expected to vest at
December 31, 2012 .................... 632 $247 7.2 $154
The total intrinsic value of options exercised during the years ended December 31, 2012, 2011 and 2010 was
$77 million, $22 million and $26 million, respectively. As of December 31, 2012, there was $22 million of total
unrecognized compensation cost related to non-vested options. The cost is expected to be recognized over a
weighted-average period of 2.6 years.
108