MasterCard 2012 Annual Report Download - page 65
Download and view the complete annual report
Please find page 65 of the 2012 MasterCard annual report below. You can navigate through the pages in the report by either clicking on the pages listed below, or by using the keyword search tool below to find specific information within the annual report.-
 1
1 -
2
-
3
-
4
-
5
-
6
-
7
-
8
-
9
-
10
-
11
-
12
-
13
-
14
-
15
-
16
-
17
-
18
-
19
-
20
-
21
-
22
-
23
-
24
-
25
-
26
-
27
-
28
-
29
-
30
-
31
-
32
-
33
-
34
-
35
-
36
-
37
-
38
-
39
-
40
-
41
-
42
-
43
-
44
-
45
-
46
-
47
-
48
-
49
-
50
-
51
-
52
-
53
-
54
-
 55
55 -
 56
56 -
 57
57 -
 58
58 -
 59
59 -
 60
60 -
 61
61 -
 62
62 -
 63
63 -
 64
64 -
 65
65 -
 66
66 -
 67
67 -
 68
68 -
 69
69 -
 70
70 -
 71
71 -
 72
72 -
 73
73 -
 74
74 -
 75
75 -
76
-
77
-
78
-
79
-
80
-
81
-
82
-
83
-
84
-
85
-
86
-
87
-
88
-
89
-
90
-
91
-
92
-
93
-
94
-
95
-
96
-
97
-
98
-
99
-
100
-
101
-
102
-
103
-
104
-
105
-
106
-
107
-
108
-
109
-
110
-
111
-
112
-
113
-
114
-
115
-
116
-
117
-
118
-
119
-
120
-
121
-
122
-
123
-
124
-
125
-
126
-
127
-
128
-
129
-
130
-
131
-
132
-
133
-
134
-
135
-
136
-
137
-
138
-
139
-
140
-
141
-
142
-
143
-
144
 |
 |

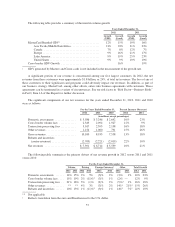
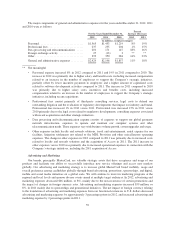
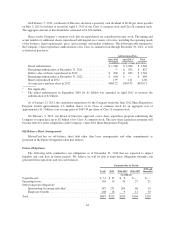
The Company’s GAAP effective tax rate for 2011 was affected by the tax benefits related to the 2011
portion of the MDL Provision. Due to the nature of this item, the Company believes that the calculation of the
2011 effective tax rate excluding the impact of the MDL Provision facilitates meaningful comparison of the
effective tax rate for 2011. The effective tax rate was 29.9% in 2012 including and excluding the portion of the
MDL Provision recorded in 2012.
GAAP to Non-GAAP effective tax rate reconciliation
For the year ended December, 31 2011
Actual MDL Provision Non-GAAP
(in millions, except percentages)
Income before income taxes ..................... $2,746 $ 770 $ 3,516
Income tax expense ............................ (842) (275) (1,117)
Loss attributable to non-controlling interests ........ 2 — 2
Net income attributable to MasterCard ............. $1,906 $ 495 $ 2,401
Effective tax rate .............................. 30.6% 31.8%
During 2012, the Company’s unrecognized tax benefits related to tax positions taken during the current and
prior periods increased by $43 million. The increase in the Company’s unrecognized tax benefits for 2012 is
primarily due to judgments related to current year tax positions. As of December 31, 2012, the Company’s
unrecognized tax benefits related to positions taken during the current and prior period were $257 million, all of
which would reduce the Company’s effective tax rate if recognized.
In 2010, in connection with the expansion of the Company’s operations in the Asia Pacific, Middle East and
Africa region, the Company’s subsidiary in Singapore, MasterCard Asia Pacific Pte. Ltd. (“MAPPL”), received
an incentive grant from the Singapore Ministry of Finance. See Note 17 (Income Taxes) to the consolidated
financial statements included in Part II, Item 8 of this Report for further discussion.
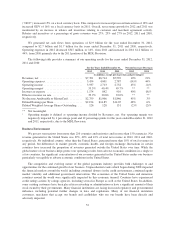
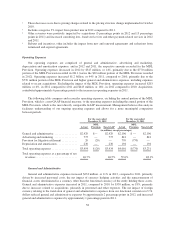
Liquidity and Capital Resources
We need liquidity and access to capital to fund our global operations, to provide for credit and settlement
risk, to finance capital expenditures, to make continued investments in our business and to service our current
and potential obligations. The Company generates the cash required to meet these needs through operations. The
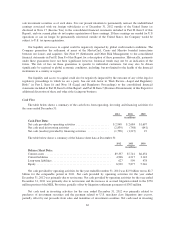
following table summarizes our cash provided by operating activities during the fiscal years presented, as well as
the cash, cash equivalents and investment securities balances and credit available to the Company at
December 31:
Years Ended December 31,
2012 2011 2010
(in millions, except per share data)
Net cash provided by operating activities ........................ $2,948 $2,684 $1,697
Cash, cash equivalents and available-for-sale investment securities1. . . 5,003 4,949 3,898
Unused line of credit2........................................ 3,000 2,750 2,750
1The 2012 balance excludes $726 million held in escrow to fund the Company’s share of the U.S. merchant
class litigation.
2The Company did not use any funds from the line of credit during the periods presented, except for business
continuity planning and related purposes.
The increase in net cash provided by operations is primarily due to increases in net income in 2012 and
2011. Cash, cash equivalents and available-for-sale investment securities held by our foreign subsidiaries (i.e.,
any entities where earnings would be subject to U.S. tax upon repatriation) was $2.5 billion and $1.8 billion at
December 31, 2012 and 2011, respectively, or 50% and 37% of our total cash, cash equivalents and available-for-
61