MasterCard 2012 Annual Report Download - page 106
Download and view the complete annual report
Please find page 106 of the 2012 MasterCard annual report below. You can navigate through the pages in the report by either clicking on the pages listed below, or by using the keyword search tool below to find specific information within the annual report.-
 1
1 -
2
-
3
-
4
-
5
-
6
-
7
-
8
-
9
-
10
-
11
-
12
-
13
-
14
-
15
-
16
-
17
-
18
-
19
-
20
-
21
-
22
-
23
-
24
-
25
-
26
-
27
-
28
-
29
-
30
-
31
-
32
-
33
-
34
-
35
-
36
-
37
-
38
-
39
-
40
-
41
-
42
-
43
-
44
-
45
-
46
-
47
-
48
-
49
-
50
-
51
-
52
-
53
-
54
-
55
-
56
-
57
-
58
-
59
-
60
-
61
-
62
-
63
-
64
-
65
-
66
-
67
-
68
-
69
-
70
-
71
-
72
-
73
-
74
-
75
-
76
-
77
-
78
-
79
-
80
-
81
-
82
-
83
-
84
-
85
-
86
-
87
-
88
-
89
-
90
-
91
-
92
-
93
-
94
-
95
-
 96
96 -
 97
97 -
 98
98 -
 99
99 -
 100
100 -
 101
101 -
 102
102 -
 103
103 -
 104
104 -
 105
105 -
 106
106 -
 107
107 -
 108
108 -
 109
109 -
 110
110 -
 111
111 -
 112
112 -
 113
113 -
 114
114 -
 115
115 -
 116
116 -
117
-
118
-
119
-
120
-
121
-
122
-
123
-
124
-
125
-
126
-
127
-
128
-
129
-
130
-
131
-
132
-
133
-
134
-
135
-
136
-
137
-
138
-
139
-
140
-
141
-
142
-
143
-
144
 |
 |

MASTERCARD INCORPORATED
NOTES TO CONSOLIDATED FINANCIAL STATEMENTS—(Continued)
three-, and five-year periods. An external advisor assists management with investment manager selections and
performance evaluations. The balance in cash and cash equivalents is available to pay expected benefit payments
and expenses. Considering the asset allocation along with intent to maintain a majority of Plan assets in fixed
income securities, the Company reduced the 2013 expected return on plan assets assumption from 6% to 5%.
The Valuation Hierarchy of the Qualified Plan’s assets is determined using a consistent application of the
categorization measurements for the Company’s financial instruments. See Note 1 (Summary of Significant
Accounting Policies).
Mutual funds (including small cap U.S. equity securities and non-U.S. equity securities) are public
investment vehicles valued at quoted market prices, which represent the net asset value of the shares held by the
Qualified Plan and are therefore included in Level 1 of the Valuation Hierarchy. Commingled funds (including
large/medium cap U.S. equity securities and fixed income securities) are valued at unit values provided by
investment managers, which are based on the fair value of the underlying investments utilizing public
information, independent external valuation from third-party services or third-party advisors, and are therefore
included in Level 2 of the Valuation Hierarchy.
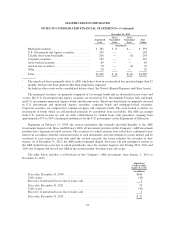
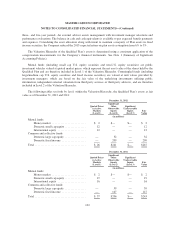
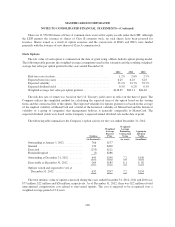
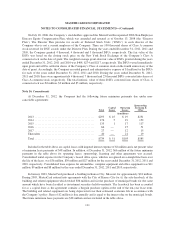
The following tables set forth by level, within the Valuation Hierarchy, the Qualified Plan’s assets at fair
value as of December 31, 2012 and 2011:
December 31, 2012
Quoted Prices
in Active
Markets
(Level 1)
Significant
Other
Observable
Inputs
(Level 2)
Significant
Unobservable
Inputs
(Level 3)
Fair
Value
(in millions)
Mutual funds:
Money market ........................ $ 2 $— $— $ 2
Domestic small cap equity ............... 12 — — 12
International equity .................... 12 — — 12
Common and collective funds:
Domestic large cap equity ............... — 32 — 32
Domestic fixed income ................. — 209 — 209
Total .................................... $ 26 $241 $— $267
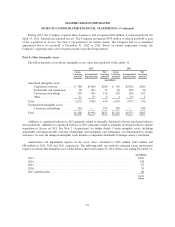
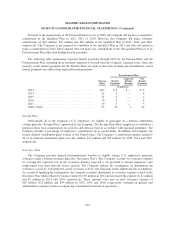
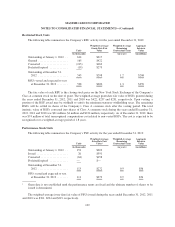
December 31, 2011
Quoted Prices
in Active
Markets
(Level 1)
Significant
Other
Observable
Inputs
(Level 2)
Significant
Unobservable
Inputs
(Level 3)
Fair
Value
(in millions)
Mutual funds:
Money market ........................ $ 2 $— $— $ 2
Domestic small cap equity ............... 19 — — 19
International equity .................... 16 — — 16
Common and collective funds:
Domestic large cap equity ............... — 59 — 59
Domestic fixed income ................. — 147 — 147
Total .................................... $ 37 $206 $— $243
102