MasterCard 2012 Annual Report Download - page 105
Download and view the complete annual report
Please find page 105 of the 2012 MasterCard annual report below. You can navigate through the pages in the report by either clicking on the pages listed below, or by using the keyword search tool below to find specific information within the annual report.-
 1
1 -
2
-
3
-
4
-
5
-
6
-
7
-
8
-
9
-
10
-
11
-
12
-
13
-
14
-
15
-
16
-
17
-
18
-
19
-
20
-
21
-
22
-
23
-
24
-
25
-
26
-
27
-
28
-
29
-
30
-
31
-
32
-
33
-
34
-
35
-
36
-
37
-
38
-
39
-
40
-
41
-
42
-
43
-
44
-
45
-
46
-
47
-
48
-
49
-
50
-
51
-
52
-
53
-
54
-
55
-
56
-
57
-
58
-
59
-
60
-
61
-
62
-
63
-
64
-
65
-
66
-
67
-
68
-
69
-
70
-
71
-
72
-
73
-
74
-
75
-
76
-
77
-
78
-
79
-
80
-
81
-
82
-
83
-
84
-
85
-
86
-
87
-
88
-
89
-
90
-
91
-
92
-
93
-
94
-
 95
95 -
 96
96 -
 97
97 -
 98
98 -
 99
99 -
 100
100 -
 101
101 -
 102
102 -
 103
103 -
 104
104 -
 105
105 -
 106
106 -
 107
107 -
 108
108 -
 109
109 -
 110
110 -
 111
111 -
 112
112 -
 113
113 -
 114
114 -
 115
115 -
116
-
117
-
118
-
119
-
120
-
121
-
122
-
123
-
124
-
125
-
126
-
127
-
128
-
129
-
130
-
131
-
132
-
133
-
134
-
135
-
136
-
137
-
138
-
139
-
140
-
141
-
142
-
143
-
144
 |
 |

MASTERCARD INCORPORATED
NOTES TO CONSOLIDATED FINANCIAL STATEMENTS—(Continued)
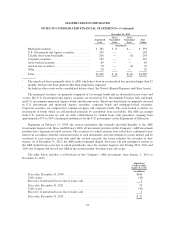
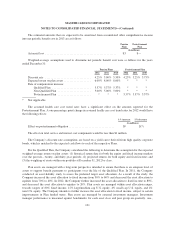
The estimated amounts that are expected to be amortized from accumulated other comprehensive income
into net periodic benefit cost in 2013 are as follows:
Pension
Plans
Postretirement
Plan
(in millions)
Actuarial loss .................................................. $3 $—
Weighted-average assumptions used to determine net periodic benefit cost were as follows for the years
ended December 31:
Pension Plans Postretirement Plan
2012 2011 2010 2012 2011 2010
Discount rate ................................ 4.25% 5.00% 5.50% 4.25% 5.25% 5.75%
Expected return on plan assets ................... 6.00% 8.00% 8.00% * * *
Rate of compensation increase:
Qualified Plan ........................... 5.37% 5.37% 5.37% * * *
Non-Qualified Plan ....................... 5.00% 5.00% 5.00% * * *
Postretirement Plan .......................***5.37% 5.37% 5.37%
* Not Applicable
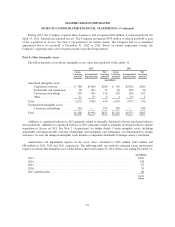
The assumed health care cost trend rates have a significant effect on the amounts reported for the
Postretirement Plan. A one-percentage point change in assumed health care cost trend rates for 2012 would have
the following effects:
1% increase 1% decrease
(in millions)
Effect on postretirement obligation ................................ $9 $(7)
The effect on total service and interest cost components would be less than $1 million.
The Company’s discount rate assumptions are based on a yield curve derived from high quality corporate
bonds, which is matched to the expected cash flows to each of the respective Plans.
For the Qualified Plan, the Company considered the following to determine the assumption for the expected
weighted-average return on plan assets: (1) historical return data for both the equity and fixed income markets
over the past ten-, twenty- and thirty-year periods; (2) projected returns for both equity and fixed income; and
(3) the weighting of assets within our portfolio at December 31, 2012 by class.
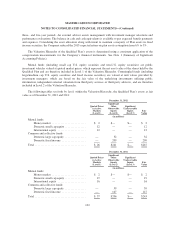
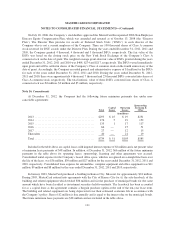
Plan assets are managed with a long-term perspective intended to ensure that there is an adequate level of
assets to support benefit payments to participants over the life of the Qualified Plan. In 2011, the Company
conducted an asset-liability study to assess the preferred target asset allocation. As a result of the study, the
Company increased the asset allocation to fixed income from 30% to 60% and decreased the asset allocation to
equities from 70% to 40%. In 2012, the Company further increased the asset allocation to fixed income to 80%,
and decreased the asset allocation to equities to 20%. Plan assets are managed within asset allocation ranges,
towards targets of 80% fixed income, 12% large/medium cap U.S. equity, 4% small cap U.S. equity, and 4%
non-U.S. equity. The Company intends to further increase the asset allocation to fixed income, subject to certain
improvements in Plan funded status. Plan assets are managed by external investment managers. Investment
manager performance is measured against benchmarks for each asset class and peer group on quarterly, one-,
101