MasterCard 2012 Annual Report Download - page 117
Download and view the complete annual report
Please find page 117 of the 2012 MasterCard annual report below. You can navigate through the pages in the report by either clicking on the pages listed below, or by using the keyword search tool below to find specific information within the annual report.-
 1
1 -
2
-
3
-
4
-
5
-
6
-
7
-
8
-
9
-
10
-
11
-
12
-
13
-
14
-
15
-
16
-
17
-
18
-
19
-
20
-
21
-
22
-
23
-
24
-
25
-
26
-
27
-
28
-
29
-
30
-
31
-
32
-
33
-
34
-
35
-
36
-
37
-
38
-
39
-
40
-
41
-
42
-
43
-
44
-
45
-
46
-
47
-
48
-
49
-
50
-
51
-
52
-
53
-
54
-
55
-
56
-
57
-
58
-
59
-
60
-
61
-
62
-
63
-
64
-
65
-
66
-
67
-
68
-
69
-
70
-
71
-
72
-
73
-
74
-
75
-
76
-
77
-
78
-
79
-
80
-
81
-
82
-
83
-
84
-
85
-
86
-
87
-
88
-
89
-
90
-
91
-
92
-
93
-
94
-
95
-
96
-
97
-
98
-
99
-
100
-
101
-
102
-
103
-
104
-
105
-
106
-
 107
107 -
 108
108 -
 109
109 -
 110
110 -
 111
111 -
 112
112 -
 113
113 -
 114
114 -
 115
115 -
 116
116 -
 117
117 -
 118
118 -
 119
119 -
 120
120 -
 121
121 -
 122
122 -
 123
123 -
 124
124 -
 125
125 -
 126
126 -
 127
127 -
128
-
129
-
130
-
131
-
132
-
133
-
134
-
135
-
136
-
137
-
138
-
139
-
140
-
141
-
142
-
143
-
144
 |
 |

MASTERCARD INCORPORATED
NOTES TO CONSOLIDATED FINANCIAL STATEMENTS—(Continued)
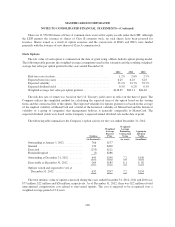
Effective Income Tax Rate
The effective income tax rates for the years ended December 31, 2012, 2011 and 2010 were 29.9%, 30.6%
and 33.0%, respectively. The effective tax rate for 2012 was lower than the effective tax rate for 2011 primarily
due to discrete benefits related to additional export incentives and the conclusion of tax examinations in certain
jurisdictions, as well as a larger benefit from the domestic production activities deduction in the U.S. related to
our authorization software. The effective tax rate for 2011 was lower than the effective tax rate for 2010
primarily due to a more favorable geographic mix of earnings, including the tax benefit related to the U.S.
merchant litigations, and the recognition of discrete adjustments in 2011.
In 2010, in connection with the expansion of the Company’s operations in the Asia Pacific, Middle East and
Africa region, the Company’s subsidiary in Singapore, MasterCard Asia Pacific Pte. Ltd. (“MAPPL”) received
an incentive grant from the Singapore Ministry of Finance. The incentive had provided MAPPL with, among
other benefits, a reduced income tax rate for the 10-year period commencing January 1, 2010 on taxable income
in excess of a base amount. The Company continued to explore business opportunities in this region, resulting in
an expansion of the incentives being granted by the Ministry of Finance, including a further reduction to the
income tax rate on taxable income in excess of a revised fixed base amount commencing July 1, 2011 and
continuing through December 31, 2025. Without the incentive grant, MAPPL would have been subject to the
statutory income tax rate on its 2011 earnings. For 2012 and 2011, the impact of the incentive grant received
from the Ministry of Finance resulted in a reduction of MAPPL’s income tax liability of $64 million, or $0.51
per diluted share, and $44 million, or $0.34 per diluted share, respectively.
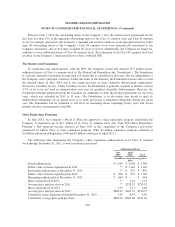
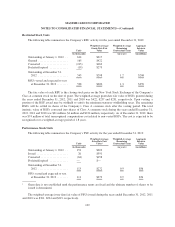
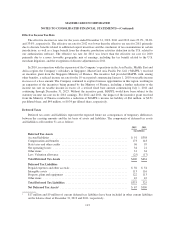
Deferred Taxes
Deferred tax assets and liabilities represent the expected future tax consequences of temporary differences
between the carrying amounts and the tax basis of assets and liabilities. The components of deferred tax assets
and liabilities at December 31 are as follows:
2012 2011
(in millions)
Deferred Tax Assets
Accrued liabilities ...................................................... $ 91 $358
Compensation and benefits ............................................... 173 143
State taxes and other credits .............................................. 96 95
Net operating losses .................................................... 34 21
Other items ........................................................... 31 34
Less: Valuation allowance ............................................... (25) (17)
Total Deferred Tax Assets .............................................. $400 $634
Deferred Tax Liabilities
Prepaid expenses and other accruals ........................................ $ 56 $ 54
Intangible assets ....................................................... 113 116
Property, plant and equipment ............................................ 122 113
Other items ........................................................... 42 42
Total Deferred Tax Liabilities ........................................... $333 325
Net Deferred Tax Assets1............................................... $ 67 $309
1$17 million and $9 million of current deferred tax liabilities have been included in other current liabilities
on the balance sheet at December 31, 2012 and 2011, respectively.
113