MasterCard 2012 Annual Report Download - page 55
Download and view the complete annual report
Please find page 55 of the 2012 MasterCard annual report below. You can navigate through the pages in the report by either clicking on the pages listed below, or by using the keyword search tool below to find specific information within the annual report.-
 1
1 -
2
-
3
-
4
-
5
-
6
-
7
-
8
-
9
-
10
-
11
-
12
-
13
-
14
-
15
-
16
-
17
-
18
-
19
-
20
-
21
-
22
-
23
-
24
-
25
-
26
-
27
-
28
-
29
-
30
-
31
-
32
-
33
-
34
-
35
-
36
-
37
-
38
-
39
-
40
-
41
-
42
-
43
-
44
-
 45
45 -
 46
46 -
 47
47 -
 48
48 -
 49
49 -
 50
50 -
 51
51 -
 52
52 -
 53
53 -
 54
54 -
 55
55 -
 56
56 -
 57
57 -
 58
58 -
 59
59 -
 60
60 -
 61
61 -
 62
62 -
 63
63 -
 64
64 -
 65
65 -
66
-
67
-
68
-
69
-
70
-
71
-
72
-
73
-
74
-
75
-
76
-
77
-
78
-
79
-
80
-
81
-
82
-
83
-
84
-
85
-
86
-
87
-
88
-
89
-
90
-
91
-
92
-
93
-
94
-
95
-
96
-
97
-
98
-
99
-
100
-
101
-
102
-
103
-
104
-
105
-
106
-
107
-
108
-
109
-
110
-
111
-
112
-
113
-
114
-
115
-
116
-
117
-
118
-
119
-
120
-
121
-
122
-
123
-
124
-
125
-
126
-
127
-
128
-
129
-
130
-
131
-
132
-
133
-
134
-
135
-
136
-
137
-
138
-
139
-
140
-
141
-
142
-
143
-
144
 |
 |
Item 7. Management’s Discussion and Analysis of Financial Condition and Results of Operations
The following discussion should be read in conjunction with the consolidated financial statements and notes
of MasterCard Incorporated and its consolidated subsidiaries, including MasterCard International Incorporated
(“MasterCard International”) (together, “MasterCard” or the “Company”), included elsewhere in this Report.
Percentage changes provided throughout “Management’s Discussion and Analysis of Financial Condition and
Results of Operations” were calculated on amounts rounded to the nearest thousand.
Non-GAAP Financial Information
Non-GAAP financial information is defined as a numerical measure of a company’s performance that
excludes or includes amounts so as to be different than the most comparable measure calculated and presented in
accordance with accounting principles generally accepted in the United States (“GAAP”). Pursuant to the
requirements of Regulation S-K, portions of this “Management’s Discussion and Analysis of Financial Condition
and Results of Operations” include a reconciliation of certain non-GAAP financial measures to the most directly
comparable GAAP financial measures. The presentation of non-GAAP financial measures should not be
considered in isolation or as a substitute for the Company’s related financial results prepared in accordance with
GAAP.
MasterCard presents non-GAAP financial measures to enhance an investor’s evaluation of MasterCard’s
ongoing operating results and to facilitate meaningful comparison of its results between periods. MasterCard’s
management uses these non-GAAP financial measures to, among other things, evaluate its ongoing operations in
relation to historical results, for internal planning and forecasting purposes and in the calculation of performance-
based compensation. More specifically, the following non-GAAP financial measures are presented in
Management’s Discussion and Analysis of Financial Condition and Results of Operations:
•Total operating expenses excluding the provisions recorded in 2012 ($20 million) and 2011 ($770
million) for potential litigation settlements relating to U.S. merchant litigations (collectively referred to
as the “MDL Provision”). MasterCard excluded this item because MasterCard’s management
monitors provisions for material litigation settlements separately from ongoing operations and evaluates
ongoing performance without these amounts. See “Operating Expenses” for the table that provides a
reconciliation of operating expenses excluding the MDL Provision to the most directly comparable
GAAP measure.
•Effective income tax rate excluding the 2011 portion of the MDL Provision. MasterCard excluded this
item because MasterCard’s management monitors provisions for material litigation settlements
separately from ongoing operations and evaluates ongoing performance without these amounts. See
“Income Taxes” for the table that provides a reconciliation of the effective income tax rate excluding the
2011 portion of the MDL Provision to the most directly comparable 2011 GAAP measure.
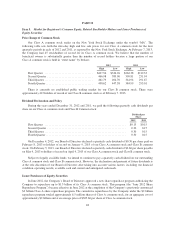
Overview
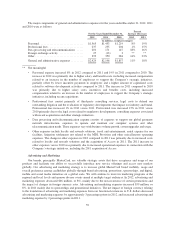
We recorded net income of $2.8 billion, or $21.94 per diluted share in 2012 versus net income of $1.9
billion, or $14.85 per diluted share in 2011, and net income of $1.8 billion, or $14.05 per diluted share in 2010.
Our 2011 net income was significantly impacted by the $770 million portion of the MDL Provision ($495 million
after tax) recorded in 2011. In 2012, the Company increased the provision by $20 million ($13 million after tax).
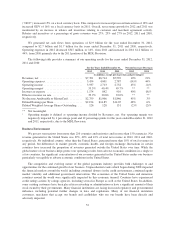
In 2012, net revenue grew at 10% compared to net revenue growth of 21% in 2011. Revenue growth in both
2012 and 2011 was driven primarily by growth in the volume of transactions and the number of transactions. We
generate revenues from the fees that we charge our customers for providing transaction processing and other
payment-related services and by assessing our customers based primarily on the dollar volume of activity on the
cards and other devices that carry our brands. In 2012, volume-based revenues (domestic assessments and cross-
border volume fees) and transaction-based revenues (transaction processing fees) increased compared to 2011 by
13%. In 2012, our processed transactions increased 25% and our MasterCard branded gross dollar volume
51