MasterCard 2012 Annual Report Download - page 63
Download and view the complete annual report
Please find page 63 of the 2012 MasterCard annual report below. You can navigate through the pages in the report by either clicking on the pages listed below, or by using the keyword search tool below to find specific information within the annual report.-
 1
1 -
2
-
3
-
4
-
5
-
6
-
7
-
8
-
9
-
10
-
11
-
12
-
13
-
14
-
15
-
16
-
17
-
18
-
19
-
20
-
21
-
22
-
23
-
24
-
25
-
26
-
27
-
28
-
29
-
30
-
31
-
32
-
33
-
34
-
35
-
36
-
37
-
38
-
39
-
40
-
41
-
42
-
43
-
44
-
45
-
46
-
47
-
48
-
49
-
50
-
51
-
52
-
 53
53 -
 54
54 -
 55
55 -
 56
56 -
 57
57 -
 58
58 -
 59
59 -
 60
60 -
 61
61 -
 62
62 -
 63
63 -
 64
64 -
 65
65 -
 66
66 -
 67
67 -
 68
68 -
 69
69 -
 70
70 -
 71
71 -
 72
72 -
 73
73 -
74
-
75
-
76
-
77
-
78
-
79
-
80
-
81
-
82
-
83
-
84
-
85
-
86
-
87
-
88
-
89
-
90
-
91
-
92
-
93
-
94
-
95
-
96
-
97
-
98
-
99
-
100
-
101
-
102
-
103
-
104
-
105
-
106
-
107
-
108
-
109
-
110
-
111
-
112
-
113
-
114
-
115
-
116
-
117
-
118
-
119
-
120
-
121
-
122
-
123
-
124
-
125
-
126
-
127
-
128
-
129
-
130
-
131
-
132
-
133
-
134
-
135
-
136
-
137
-
138
-
139
-
140
-
141
-
142
-
143
-
144
 |
 |

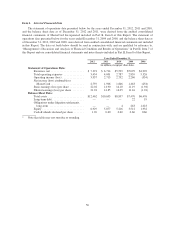
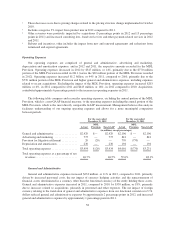
The major components of general and administrative expenses for the years ended December 31, 2012, 2011
and 2010 were as follows:
For the Years Ended December 31,
Percent
Increase (Decrease)
2012 2011 2010 2012 2011
(in millions, except percentages)
Personnel .............................. $1,565 $1,453 $1,219 8% 19%
Professional fees ......................... 237 235 204 1% 15%
Data processing and telecommunications ..... 201 171 147 18% 16%
Foreign exchange activity ................. 27 (13) 3 ** **
Other .................................. 399 350 284 14% 23%
General and administrative expenses ......... $2,429 $2,196 $1,857 11% 18%
** Not meaningful
• Personnel expense increased 8% in 2012 compared to 2011 and 19% in 2011 compared to 2010. The
increase in 2012 was primarily due to higher salary and benefit costs, including increased compensation
related to an increase in the number of employees to support the Company’s strategic initiatives,
partially offset by lower incentive payments to employees and a higher amount of capitalized costs
related to software development activities compared to 2011. The increase in 2011 compared to 2010
was primarily due to higher salary costs, incentives and benefits costs, including increased
compensation related to an increase in the number of employees to support the Company’s strategic
initiatives, including recent acquisitions.
• Professional fees consist primarily of third-party consulting services, legal costs to defend our
outstanding litigation and the evaluation of regulatory developments that impact our industry and brand.
Professional fees increased 1% in 2012 versus 2011. Professional fees increased 15% in 2011 versus
2010 primarily due to the legal costs related to regulatory developments, consulting expenses associated
with recent acquisitions and other strategic initiatives.
• Data processing and telecommunication expense consists of expenses to support our global payments
network infrastructure, expenses to operate and maintain our computer systems and other
telecommunication needs. These expenses vary with business volume growth, system upgrades and usage.
• Other expenses include loyalty and rewards solutions, travel and entertainment, rental expense for our
facilities, litigation settlements not related to the MDL Provision and other miscellaneous operating
expenses. The change in other expenses in 2012 compared to 2011 was primarily due to increased costs
related to loyalty and rewards solutions and the acquisition of Access in 2011. The 2011 increase in
other expenses versus 2010 was primarily due to increased operational expenses in connection with the
Company’s strategic initiatives, including the 2011 acquisition of Access.
Advertising and Marketing
Our brands, principally MasterCard, are valuable strategic assets that drive acceptance and usage of our
products and facilitate our ability to successfully introduce new service offerings and access new markets
globally. Our advertising and marketing strategy is to increase global MasterCard brand visibility, usage and
overall preference among cardholders globally through brand advertising, promotions, sponsorships, and digital,
mobile and social media initiatives on a global scale. We will continue to invest in marketing programs at the
regional and local levels and sponsor diverse events aimed at multiple target audiences. In 2012, advertising and
marketing expenses decreased $66 million, or 8%, mainly due to the non-recurrence of certain promotions and
the impact of changes in foreign currency rates. Advertising and marketing expenses increased $59 million, or
8%, in 2011 mainly due to sponsorships and promotional initiatives. The net impact of foreign currency relating
to the translation of advertising and marketing expenses from our functional currencies to U.S. dollars decreased
advertising and marketing expenses by approximately 3 percentage points in 2012, and increased advertising and
marketing expense by 2 percentage points in 2011.
59