MasterCard 2012 Annual Report Download - page 66
Download and view the complete annual report
Please find page 66 of the 2012 MasterCard annual report below. You can navigate through the pages in the report by either clicking on the pages listed below, or by using the keyword search tool below to find specific information within the annual report.-
 1
1 -
2
-
3
-
4
-
5
-
6
-
7
-
8
-
9
-
10
-
11
-
12
-
13
-
14
-
15
-
16
-
17
-
18
-
19
-
20
-
21
-
22
-
23
-
24
-
25
-
26
-
27
-
28
-
29
-
30
-
31
-
32
-
33
-
34
-
35
-
36
-
37
-
38
-
39
-
40
-
41
-
42
-
43
-
44
-
45
-
46
-
47
-
48
-
49
-
50
-
51
-
52
-
53
-
54
-
55
-
 56
56 -
 57
57 -
 58
58 -
 59
59 -
 60
60 -
 61
61 -
 62
62 -
 63
63 -
 64
64 -
 65
65 -
 66
66 -
 67
67 -
 68
68 -
 69
69 -
 70
70 -
 71
71 -
 72
72 -
 73
73 -
 74
74 -
 75
75 -
 76
76 -
77
-
78
-
79
-
80
-
81
-
82
-
83
-
84
-
85
-
86
-
87
-
88
-
89
-
90
-
91
-
92
-
93
-
94
-
95
-
96
-
97
-
98
-
99
-
100
-
101
-
102
-
103
-
104
-
105
-
106
-
107
-
108
-
109
-
110
-
111
-
112
-
113
-
114
-
115
-
116
-
117
-
118
-
119
-
120
-
121
-
122
-
123
-
124
-
125
-
126
-
127
-
128
-
129
-
130
-
131
-
132
-
133
-
134
-
135
-
136
-
137
-
138
-
139
-
140
-
141
-
142
-
143
-
144
 |
 |

sale investment securities as of such dates. It is our present intention to permanently reinvest the undistributed
earnings associated with our foreign subsidiaries as of December 31, 2012 outside of the United States (as
disclosed in Note 17 (Income Tax) to the consolidated financial statements included in Part II, Item 8 of this
Report), and our current plans do not require repatriation of these earnings. If these earnings are needed for U.S
operations or can no longer be permanently reinvested outside of the United States, the Company would be
subject to U.S. tax upon repatriation.
Our liquidity and access to capital could be negatively impacted by global credit market conditions. The
Company guarantees the settlement of many of the MasterCard, Cirrus and Maestro branded transactions
between our issuers and acquirers. See Note 19 (Settlement and Other Risk Management) to the consolidated
financial statements in Part II, Item 8 of this Report for a description of these guarantees. Historically, payments
under these guarantees have not been significant; however, historical trends may not be an indication of the
future. The risk of loss on these guarantees is specific to individual customers, but may also be driven
significantly by regional or global economic conditions, including, but not limited to the health of the financial
institutions in a country or region.
Our liquidity and access to capital could also be negatively impacted by the outcome of any of the legal or
regulatory proceedings to which we are a party. See our risk factor in “Risk Factors—Legal and Regulatory
Risks” in Part I, Item 1A and Note 18 (Legal and Regulatory Proceedings) to the consolidated financial
statements included in Part II, Item 8 of this Report; and Part II, Item 7 (Business Environment) of this Report for
additional discussion of these and other risks facing our business.
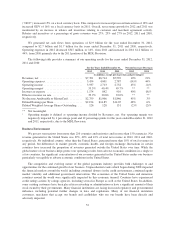
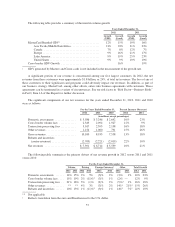
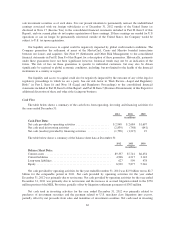
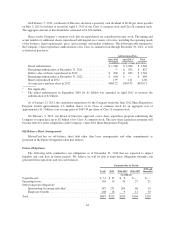
Cash Flow
The table below shows a summary of the cash flows from operating, investing and financing activities for
the years ended December 31:
2012 2011 2010
(in millions)
Cash Flow Data:
Net cash provided by operating activities ....................... $2,948 $ 2,684 $1,697
Net cash used in investing activities ........................... (2,839) (748) (641)
Net cash (used in) provided by financing activities ............... (1,798) (1,215) 19
The table below shows a summary of the balance sheet data at December 31:
2012 2011 2010
(in millions)
Balance Sheet Data:
Current assets .............................................. $9,357 $7,741 $6,454
Current liabilities ........................................... 4,906 4,217 3,143
Long-term liabilities ......................................... 627 599 478
Equity .................................................... 6,929 5,877 5,216
Net cash provided by operating activities for the year ended December 31, 2012 was $2.9 billion versus $2.7
billion for the comparable period in 2011. Net cash provided by operating activities for the year ended
December 31, 2012 was primarily due to net income. Net cash provided by operating activities for the year ended
December 31, 2011 was primarily due to net income and the increase in accrued litigation related to the $770
million portion of the MDL Provision, partially offset by litigation settlement payments of $303 million.
Net cash used in investing activities for the year ended December 31, 2012 was primarily related to
purchases of investment securities and the payment related to U.S. merchant class litigations into escrow,
partially offset by net proceeds from sales and maturities of investment securities. Net cash used in investing
62