MasterCard 2012 Annual Report Download - page 56
Download and view the complete annual report
Please find page 56 of the 2012 MasterCard annual report below. You can navigate through the pages in the report by either clicking on the pages listed below, or by using the keyword search tool below to find specific information within the annual report.-
 1
1 -
2
-
3
-
4
-
5
-
6
-
7
-
8
-
9
-
10
-
11
-
12
-
13
-
14
-
15
-
16
-
17
-
18
-
19
-
20
-
21
-
22
-
23
-
24
-
25
-
26
-
27
-
28
-
29
-
30
-
31
-
32
-
33
-
34
-
35
-
36
-
37
-
38
-
39
-
40
-
41
-
42
-
43
-
44
-
45
-
 46
46 -
 47
47 -
 48
48 -
 49
49 -
 50
50 -
 51
51 -
 52
52 -
 53
53 -
 54
54 -
 55
55 -
 56
56 -
 57
57 -
 58
58 -
 59
59 -
 60
60 -
 61
61 -
 62
62 -
 63
63 -
 64
64 -
 65
65 -
 66
66 -
67
-
68
-
69
-
70
-
71
-
72
-
73
-
74
-
75
-
76
-
77
-
78
-
79
-
80
-
81
-
82
-
83
-
84
-
85
-
86
-
87
-
88
-
89
-
90
-
91
-
92
-
93
-
94
-
95
-
96
-
97
-
98
-
99
-
100
-
101
-
102
-
103
-
104
-
105
-
106
-
107
-
108
-
109
-
110
-
111
-
112
-
113
-
114
-
115
-
116
-
117
-
118
-
119
-
120
-
121
-
122
-
123
-
124
-
125
-
126
-
127
-
128
-
129
-
130
-
131
-
132
-
133
-
134
-
135
-
136
-
137
-
138
-
139
-
140
-
141
-
142
-
143
-
144
 |
 |

(“GDV”) increased 15% on a local currency basis. This compares to increased processed transactions of 18% and
increased GDV of 16% on a local currency basis in 2011. Overall, net revenue growth for 2012 and 2011 was
moderated by an increase in rebates and incentives relating to customer and merchant agreement activity.
Rebates and incentives as a percentage of gross revenues were 27%, 25% and 27% in 2012, 2011 and 2010,
respectively.
We generated net cash flows from operations of $2.9 billion for the year ended December 31, 2012,
compared to $2.7 billion and $1.7 billion for the years ended December 31, 2011 and 2010, respectively.
Operating expenses in 2012 decreased $547 million, or 14%, from 2011 and increased in 2011 $1.2 billion, or
44%, from 2010 primarily due to the 2011 portion of the MDL Provision.
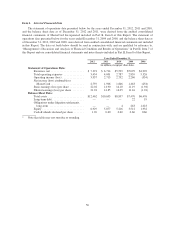
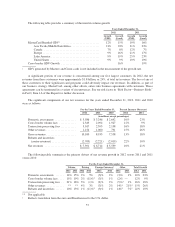
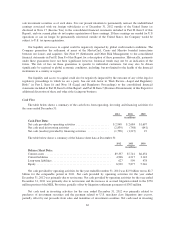
The following table provides a summary of our operating results for the years ended December 31, 2012,
2011 and 2010:
For the Years Ended December 31, Percent Increase (Decrease)
2012 2011 2010 2012 2011
(in millions, except per share data and percentages)
Revenues, net .............................. $7,391 $6,714 $5,539 10% 21%
Operating expenses .......................... 3,454 4,001 2,787 (14)% 44%
Operating income ........................... 3,937 2,713 2,752 45% (1)%
Operating margin1.......................... 53.3% 40.4% 49.7% ** **
Income tax expense ......................... 1,174 842 910 40% (8)%
Effective income tax rate ..................... 29.9% 30.6% 33.0% ** **
Net Income Attributable to MasterCard .......... $2,759 $1,906 $1,846 45% 3%
Diluted Earnings per Share .................... $21.94 $14.85 $14.05 48% 6%
Diluted Weighted-Average Shares Outstanding . . . 126 128 131 (2)% (2)%
** Not meaningful.
1Operating margin is defined as operating income divided by Revenues, net. Our operating margin was
negatively impacted by 1 percentage point and 12 percentage points for the years ended December 31, 2012
and 2011, respectively, due to the MDL Provision.
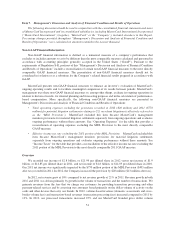
Business Environment
We process transactions from more than 210 countries and territories and in more than 150 currencies. Net
revenue generated in the United States was 39%, 40% and 42% of total net revenue in 2012, 2011 and 2010,
respectively. No individual country, other than the United States, generated more than 10% of total revenues in
any period, but differences in market growth, economic health, and foreign exchange fluctuations in certain
countries have increased the proportion of revenues generated outside the United States over time. While the
global nature of our business helps protect our operating results from adverse economic conditions in a single or
a few countries, the significant concentration of our revenues generated in the United States makes our business
particularly susceptible to adverse economic conditions in the United States.
The competitive and evolving nature of the global payments industry provides both challenges to and
opportunities for the continued growth of our business. Unprecedented events which began during 2008 impacted
the financial markets around the world, including continued distress in the credit environment, continued equity
market volatility and additional government intervention. The economies of the United States and numerous
countries around the world were significantly impacted by this economic turmoil. Countries have experienced
credit ratings actions by ratings agencies, including several in Europe as well as the United States. In addition,
some existing customers have been placed in receivership or administration or have a significant amount of their
stock owned by their governments. Many financial institutions are facing increased regulatory and governmental
influence, including potential further changes in laws and regulations. Many of our financial institution
customers, merchants that accept our brands and cardholders who use our brands have been directly and
adversely impacted.
52