MasterCard 2012 Annual Report Download - page 21
Download and view the complete annual report
Please find page 21 of the 2012 MasterCard annual report below. You can navigate through the pages in the report by either clicking on the pages listed below, or by using the keyword search tool below to find specific information within the annual report.-
 1
1 -
2
-
3
-
4
-
5
-
6
-
7
-
8
-
9
-
10
-
 11
11 -
 12
12 -
 13
13 -
 14
14 -
 15
15 -
 16
16 -
 17
17 -
 18
18 -
 19
19 -
 20
20 -
 21
21 -
 22
22 -
 23
23 -
 24
24 -
 25
25 -
 26
26 -
 27
27 -
 28
28 -
 29
29 -
 30
30 -
 31
31 -
32
-
33
-
34
-
35
-
36
-
37
-
38
-
39
-
40
-
41
-
42
-
43
-
44
-
45
-
46
-
47
-
48
-
49
-
50
-
51
-
52
-
53
-
54
-
55
-
56
-
57
-
58
-
59
-
60
-
61
-
62
-
63
-
64
-
65
-
66
-
67
-
68
-
69
-
70
-
71
-
72
-
73
-
74
-
75
-
76
-
77
-
78
-
79
-
80
-
81
-
82
-
83
-
84
-
85
-
86
-
87
-
88
-
89
-
90
-
91
-
92
-
93
-
94
-
95
-
96
-
97
-
98
-
99
-
100
-
101
-
102
-
103
-
104
-
105
-
106
-
107
-
108
-
109
-
110
-
111
-
112
-
113
-
114
-
115
-
116
-
117
-
118
-
119
-
120
-
121
-
122
-
123
-
124
-
125
-
126
-
127
-
128
-
129
-
130
-
131
-
132
-
133
-
134
-
135
-
136
-
137
-
138
-
139
-
140
-
141
-
142
-
143
-
144
 |
 |
•Rebates and incentives (contra-revenue): Rebates and incentives are provided to certain MasterCard
customers and are recorded as contra-revenue in the same period that performance occurs.
Our pricing is complex and is dependent on the nature of the volumes, types of transactions and other
products and services we offer to our customers. The following factors impact the pricing:
• Domestic or cross-border
• Signature-based or PIN-based
• Tiered rates that fluctuate based on volume/transaction hurdles
• Geographic region or country
• Retail purchase or cash withdrawal
• Processed or not processed on the MasterCard Worldwide Network
In general, a cross-border transaction generates higher revenue than a domestic transaction since cross-
border fees are higher than domestic fees, and in most cases also include fees for currency conversion. We
review our pricing and implement pricing changes on an ongoing basis. In addition, standard pricing varies
among our regions, and such standard pricing can be modified for our customers through customer-specific
incentive and rebate agreements. Revenues from processing cross-border transactions fluctuate with cross-border
activities. See our risk factor in “Risk Factors—Business Risks” in Part I, Item 1A of this Report related to cross-
border travel.
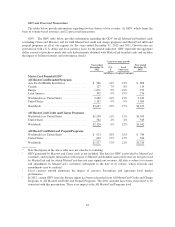
In 2012, net revenues from our five largest customers accounted for approximately $1.8 billion, or 24% of
our total revenue. No single customer generated greater than 10% of total revenue.
See “Management’s Discussion and Analysis of Financial Condition and Results of Operations—Revenues”
in Part II, Item 7 for more detail.
17