LensCrafters 2009 Annual Report Download - page 98
Download and view the complete annual report
Please find page 98 of the 2009 LensCrafters annual report below. You can navigate through the pages in the report by either clicking on the pages listed below, or by using the keyword search tool below to find specific information within the annual report.-
 1
1 -
2
-
3
-
4
-
5
-
6
-
7
-
8
-
9
-
10
-
11
-
12
-
13
-
14
-
15
-
16
-
17
-
18
-
19
-
20
-
21
-
22
-
23
-
24
-
25
-
26
-
27
-
28
-
29
-
30
-
31
-
32
-
33
-
34
-
35
-
36
-
37
-
38
-
39
-
40
-
41
-
42
-
43
-
44
-
45
-
46
-
47
-
48
-
49
-
50
-
51
-
52
-
53
-
54
-
55
-
56
-
57
-
58
-
59
-
60
-
61
-
62
-
63
-
64
-
65
-
66
-
67
-
68
-
69
-
70
-
71
-
72
-
73
-
74
-
75
-
76
-
77
-
78
-
79
-
80
-
81
-
82
-
83
-
84
-
85
-
86
-
87
-
 88
88 -
 89
89 -
 90
90 -
 91
91 -
 92
92 -
 93
93 -
 94
94 -
 95
95 -
 96
96 -
 97
97 -
 98
98 -
 99
99 -
 100
100 -
 101
101 -
 102
102 -
 103
103 -
 104
104 -
 105
105 -
 106
106 -
 107
107 -
 108
108 -
109
-
110
-
111
-
112
-
113
-
114
-
115
-
116
-
117
-
118
-
119
-
120
-
121
-
122
-
123
-
124
-
125
-
126
-
127
-
128
 |
 |

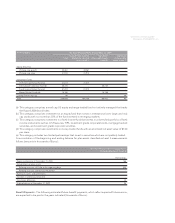
> 96 | ANNUAL REPORT 2009
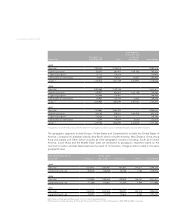
(Euro 000)
Manufacturing
and Wholesale Retail
Inter-Segments
Transactions and
Corporate
Adjustments Consolidated
2009
Net sales 1,955,340 3,138,978 5,094,318
Operating income 355,507 367,457 (139,762) 583,202
Capital expenditure 81,175 119,234 200,409
Depreciation & amortization 76,005 129,261 80,657 285,923
Assets (1) 1,700,672 1,071,439 4,363,945 7,136,056
2008
Net sales 2,092,465 3,109,146 5,201,611
Operating income 439,957 430,565 (120,759) 749,763
Capital expenditure 125,489 170,947 296,436
Depreciation & amortization 85,987 123,129 55,822 264,938
Assets (1) 1,823,950 1,083,894 4,397,381 7,305,225
2007
Net sales 1,703,662 3,262,392 4,966,054
Operating income 425,143 509,081 (100,912) 833,313
Capital expenditure 118,558 216,211 334,769
Depreciation & amortization 75,304 119,459 38,050 232,813
Assets (1) 1,789,168 1,044,893 4,323,205 7,157,266
(1) Segment assets are the total assets used in the operation of each segment. Corporate assets are primarily intangible assets and deferred tax assets
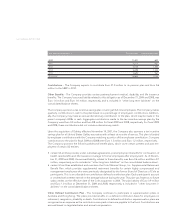
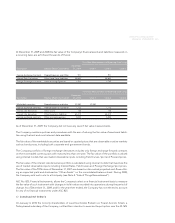
The geographic segments include Europe, United States and Canada (which includes the United States of
America, Canada and Caribbean islands), Asia-Pacific (which includes Australia, New Zealand, China, Hong
Kong and Japan) and Other (which includes all other geographic locations including, South and Central
America, South Africa and the Middle East). Sales are attributed to geographic segments based on the
customer’s location whereas fixed assets are the result of combination of legal entities located in the same
geographic area.
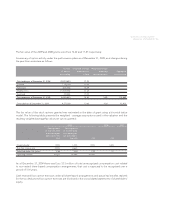
Year ended December 31,
(Euro 000) Europe (2) (3)
United States
and Canada (2) Asia-Pacific (2) Other (2) Consolidated
2009
Net sales 1,072,412 3,065,937 641,657 314,311 5,094,318
Long lived assets, net 362,525 628,540 150,126 7,726 1,148,916
2008
Net sales 1,132,465 3,096,520 645,839 326,787 5,201,611
Long lived assets, net 371,568 652,851 141,339 4,940 1,170,698
2007
Net sales 1,064,574 3,041,678 596,223 263,578 4,966,054
Long lived assets, net 346,081 572,570 135,676 3,455 1,057,782
(2) No single customer represents five percent or more of sales in any year presented.
(3) Fixed assets located in Italy represent 29 percent, 30 percent and 31 percent of the total fixed assets in 2009, 2008 and 2007, respectively.