LensCrafters 2009 Annual Report Download - page 8
Download and view the complete annual report
Please find page 8 of the 2009 LensCrafters annual report below. You can navigate through the pages in the report by either clicking on the pages listed below, or by using the keyword search tool below to find specific information within the annual report.-
 1
1 -
 2
2 -
 3
3 -
 4
4 -
 5
5 -
 6
6 -
 7
7 -
 8
8 -
 9
9 -
 10
10 -
 11
11 -
 12
12 -
 13
13 -
 14
14 -
 15
15 -
 16
16 -
 17
17 -
 18
18 -
 19
19 -
20
-
21
-
22
-
23
-
24
-
25
-
26
-
27
-
28
-
29
-
30
-
31
-
32
-
33
-
34
-
35
-
36
-
37
-
38
-
39
-
40
-
41
-
42
-
43
-
44
-
45
-
46
-
47
-
48
-
49
-
50
-
51
-
52
-
53
-
54
-
55
-
56
-
57
-
58
-
59
-
60
-
61
-
62
-
63
-
64
-
65
-
66
-
67
-
68
-
69
-
70
-
71
-
72
-
73
-
74
-
75
-
76
-
77
-
78
-
79
-
80
-
81
-
82
-
83
-
84
-
85
-
86
-
87
-
88
-
89
-
90
-
91
-
92
-
93
-
94
-
95
-
96
-
97
-
98
-
99
-
100
-
101
-
102
-
103
-
104
-
105
-
106
-
107
-
108
-
109
-
110
-
111
-
112
-
113
-
114
-
115
-
116
-
117
-
118
-
119
-
120
-
121
-
122
-
123
-
124
-
125
-
126
-
127
-
128
 |
 |

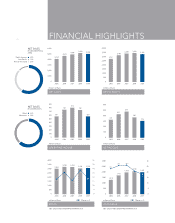
> 6 FINANCIAL HIGHLIGHTS
NET SALES
BY GEOGRAPHICAL
AREA
North America
Asia-Pacific
Rest of the world
60%
13%
27%
NET SALES
BY DISTRIBUTION
Retail
Wholesale
62%
38%
20092005 2006 2007
4,134
4,676 4,966 5,094
2008
5,202
0
1,000
2,000
3,000
4,000
5,000
6,000
millions of Euro
NET SALES
2005 2006 2007 2009
millions of Euro
581
756
813
583
2008
750
0
100
200
300
400
500
600
700
800
900
OPERATING INCOME
2005 2006 2007 2009
331
431
479
315
2008
380
0
100
200
300
400
500
600
millions of Euro
NET INCOME
2005 2006 2007 2009
2,761
3,188
3,390 3,326
2008
3,450
0
500
1,000
1,500
2,000
2,500
3,000
3,500
4,000
millions of Euro
GROSS PROFIT
2005 2006 2007 2009
3,062
3,294 3,234 3,139
2008
3,109
11.6
13.1
11.2
13.8
0
500
1,000
1,500
2,000
2,500
3,000
3,500
4,000
8
9
10
11
12
13
14
15
16
millions of Euro Margin in %
2005 2006 2007 2009
1,310
1,715
1,993 1,955
2008
2,092
23.2
26.0 26.5
21.0
0
500
1,000
1,500
2,000
2,500
3,000
0
5
10
15
20
25
30
millions of Euro
NET SALES AND OPERATING MARGIN IN % NET SALES AND OPERATING MARGIN IN %
Margin in %
RETAIL WHOLESALE
11.7
18.2