LensCrafters 2009 Annual Report Download - page 120
Download and view the complete annual report
Please find page 120 of the 2009 LensCrafters annual report below. You can navigate through the pages in the report by either clicking on the pages listed below, or by using the keyword search tool below to find specific information within the annual report.-
 1
1 -
2
-
3
-
4
-
5
-
6
-
7
-
8
-
9
-
10
-
11
-
12
-
13
-
14
-
15
-
16
-
17
-
18
-
19
-
20
-
21
-
22
-
23
-
24
-
25
-
26
-
27
-
28
-
29
-
30
-
31
-
32
-
33
-
34
-
35
-
36
-
37
-
38
-
39
-
40
-
41
-
42
-
43
-
44
-
45
-
46
-
47
-
48
-
49
-
50
-
51
-
52
-
53
-
54
-
55
-
56
-
57
-
58
-
59
-
60
-
61
-
62
-
63
-
64
-
65
-
66
-
67
-
68
-
69
-
70
-
71
-
72
-
73
-
74
-
75
-
76
-
77
-
78
-
79
-
80
-
81
-
82
-
83
-
84
-
85
-
86
-
87
-
88
-
89
-
90
-
91
-
92
-
93
-
94
-
95
-
96
-
97
-
98
-
99
-
100
-
101
-
102
-
103
-
104
-
105
-
106
-
107
-
108
-
109
-
 110
110 -
 111
111 -
 112
112 -
 113
113 -
 114
114 -
 115
115 -
 116
116 -
 117
117 -
 118
118 -
 119
119 -
 120
120 -
 121
121 -
 122
122 -
 123
123 -
 124
124 -
 125
125 -
 126
126 -
 127
127 -
 128
128
 |
 |

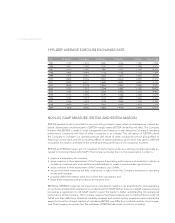
> 118 | ANNUAL REPORT 2009
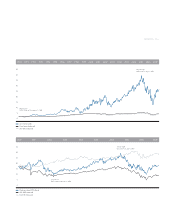
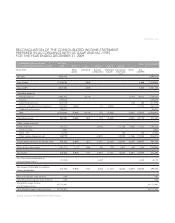
1995-2009 AVERAGE EURO/US$ EXCHANGE RATE
Year 1st quarter 2st quarter 3st quarter 4st quarter Full-year Year change
1995 1.1793 1.1613 1.2081 1.2160 1.1887 -1.05%
1996 1.2307 1.2443 1.2727 1.2721 1.2549 5.57%
1997 1.1823 1.1457 1.0991 1.1255 1.1367 -9.42%
1998 1.0802 1.0944 1.1130 1.1765 1.1152 -1.89%
1999 1.1207 1.0567 1.0483 1.0370 1.0642 -4.57%
2000 0.9859 0.9326 0.9041 0.8676 0.9209 -13.47%
2001 0.9230 0.8721 0.8895 0.8959 0.8957 -2.74%
2002 0.8766 0.9198 0.9838 0.9982 0.9450 5.50%
2003 1.0731 1.1372 1.1248 1.1882 1.1307 19.65%
2004 1.2497 1.2046 1.2220 1.2968 1.2435 9.98%
2005 1.3113 1.2594 1.2197 1.1886 1.2444 0.07%
2006 1.2023 1.2579 1.2743 1.2889 1.2553 0.88%
2007 1.3016 1.3479 1.3738 1.4486 1.3705 9.18%
2008 1.4976 1.5622 1.5055 1.3180 1.4707 7.31%
2009 1.3029 1.3632 1.4303 1.4780 1.3948 -5.16%
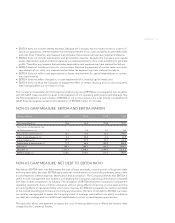
NON-US GAAP MEASURE: EBITDA AND EBITDA MARGIN
EBITDA represents net income before non-controlling interests, taxes, other income/expense, interest ex-
pense, depreciation and amortization. EBITDA margin means EBITDA divided by net sales. The Company
believes that EBITDA is useful to both management and investors in evaluating the Company’s operating
performance compared with that of other companies in its industry. The calculation of EBITDA allows
the Company to compare our operating results with those of other companies without giving effect to
fi nancing, income taxes and the accounting effects of capital spending, which items may vary for different
companies for reasons unrelated to the overall operating performance of a company’s business.
EBITDA and EBITDA margin are not measures of performance under accounting principles generally ac-
cepted in the United States (US GAAP). The Company includes them in this presentation in order to:
• improve transparency for investors;
• assist investors in their assessment of the Company’s operating performance and its ability to refinance
its debt as it matures and incur additional indebtedness to invest in new business opportunities;
• assist investors in their assessment of the Company’s cost of debt;
• ensure that these measures are fully understood in light of how the Company evaluates its operating
results and leverage;
• properly define the metrics used and confirm their calculation; and
• share these measures with all investors at the same time.
EBITDA and EBITDA margin are not meant to be considered in isolation or as a substitute for items appearing
on our fi nancial statements prepared in accordance with US GAAP. Rather, these non-GAAP measures should
be used as a supplement to US GAAP results to assist the reader in better understanding the operational
performance of the Company. The Company cautions that these measures are not defi ned terms under US
GAAP and their defi nitions should be carefully reviewed and understood by investors.Investors should be
aware that Luxottica Group’s method of calculating EBITDA may differ from methods used by other compa-
nies. The Company recognizes that the usefulness of EBITDA has certain limitations, including: