LensCrafters 2009 Annual Report Download - page 114
Download and view the complete annual report
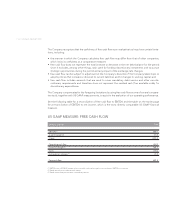
Please find page 114 of the 2009 LensCrafters annual report below. You can navigate through the pages in the report by either clicking on the pages listed below, or by using the keyword search tool below to find specific information within the annual report.-
 1
1 -
2
-
3
-
4
-
5
-
6
-
7
-
8
-
9
-
10
-
11
-
12
-
13
-
14
-
15
-
16
-
17
-
18
-
19
-
20
-
21
-
22
-
23
-
24
-
25
-
26
-
27
-
28
-
29
-
30
-
31
-
32
-
33
-
34
-
35
-
36
-
37
-
38
-
39
-
40
-
41
-
42
-
43
-
44
-
45
-
46
-
47
-
48
-
49
-
50
-
51
-
52
-
53
-
54
-
55
-
56
-
57
-
58
-
59
-
60
-
61
-
62
-
63
-
64
-
65
-
66
-
67
-
68
-
69
-
70
-
71
-
72
-
73
-
74
-
75
-
76
-
77
-
78
-
79
-
80
-
81
-
82
-
83
-
84
-
85
-
86
-
87
-
88
-
89
-
90
-
91
-
92
-
93
-
94
-
95
-
96
-
97
-
98
-
99
-
100
-
101
-
102
-
103
-
 104
104 -
 105
105 -
 106
106 -
 107
107 -
 108
108 -
 109
109 -
 110
110 -
 111
111 -
 112
112 -
 113
113 -
 114
114 -
 115
115 -
 116
116 -
 117
117 -
 118
118 -
 119
119 -
 120
120 -
 121
121 -
 122
122 -
 123
123 -
 124
124 -
125
-
126
-
127
-
128
 |
 |

> 112 | ANNUAL REPORT 2009
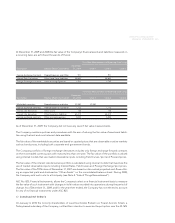
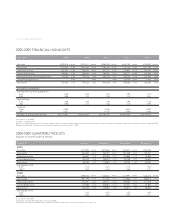
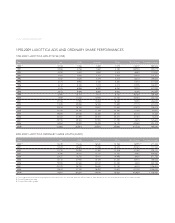
2005-2009 FINANCIAL HIGHLIGHTS
(Euro 000) 2009 2008 2007 (3) 2006 (2) 2005 (2)
Net sales 5,094,318 100.00% 5,201,611 100.00% 4,966,054 100.00% 4,676,156 100.00% 4,134,263 100.00%
Gross profi t 3,325,882 65.29% 3,450,360 66.33% 3,390,436 68.27% 3,250,156 69.50% 2,817,598 68.15%
Operating income 583,202 11.45% 749,763 14.41% 833,313 16.78% 755,987 16.17% 581,401 14.06%
Income before taxes 494,283 9.70% 589,870 11.34% 780,681 15.72% 678,177 14.50% 539,309 13.04%
Net income from continuing operations 314,762 6.18% 379,722 7.30% 492,204 9.91% 430,705 9.21% 330,790 8.00%
Discontinued operations - 0.00% - 0.00% - 0.00% (6,419) -0.14% 11,504 0.28%
Net income 314,762 6.18% 379,722 7.30% 492,204 9.91% 424,286 9.07% 342,294 8.28%
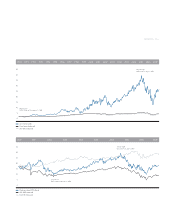
Per ordinary share/(ADS) (1)
Earnings from continuing operations:
Euro 0.69 0.83 1.08 0.95 0.73
US$ 0.96 1.22 1.48 1.19 0.91
Total earnings
Euro 0.69 0.83 1.08 0.94 0.76
US$ 0.96 1.22 1.48 1.18 0.95
Dividend
Euro 0.220 0.490 0.420 0.290
US$ 0.327 0.770 0.564 0.365
Average no. of outstanding shares 457,270,491 456,563,502 455,184,797 452,897,854 450,179,073
In accordance to US GAAP
(1) 1 ADS = 1 ordinary share.
(2) Results of Things Remembered, Inc., a former subsidiary that was sold in September 2006, are reclassifi ed as discontinued operations and are not included in results from continuing operations for 2006 and 2005.
(3) Figures include results of Oakley operations from the acquisition date (November 14, 2007).
2008-2009 QUARTERLY RESULTS
(subject to limited auditing review)
(Euro 000) (1) 1st quarter 2nd quarter 3rd quarter 4th quarter
2009
Net sales 1,312,334 100.0% 1,401,626 100.0% 1,223,272 100.0% 1,157,085
Gross profi t 860,285 65.6% 920,047 65.6% 801,349 65.5% 744,201
Operating income 156,667 11.9% 205,986 14.7% 143,664 11.7% 76,885
Income before taxes 128,239 9.8% 185,443 13.2% 125,799 10.3% 54,800
Net income 80,394 6.1% 115,683 8.3% 83,103 6.8% 35,581
Earnings per share:
Euro 0.18 0.25 0.18 0.08
US$ (2) 0.23 0.34 0.26 0.11
2008
Net sales 1,398,703 100.0% 1,354,442 100.0% 1,211,991 100.0% 1,236,476 100.0%
Gross profi t 927,793 66.3% 917,034 67.7% 811,860 67.0% 800,018 64.3%
Operating income 207,057 14.8% 230,177 17.0% 195,081 16.1% 117,448 6.6%
Income before taxes 170,468 12.2% 206,581 15.3% 161,021 13.3% 51,800 4.7%
Net income 103,705 7.4% 132,580 9.8% 104,612 8.6% 38,825 3.1%
Earnings per share:
Euro 0.23 0.29 0.23 0.09
US$ (2) 0.34 0.46 0.35 0.11
In accordance to US GAAP
(1) Except for per share (ADS) data, which is in Euro and US$.
(2) All amounts in US$ were translated at the average Euro/US$ exchange rate for the period in reference. See page 118.