LensCrafters 2009 Annual Report Download - page 58
Download and view the complete annual report
Please find page 58 of the 2009 LensCrafters annual report below. You can navigate through the pages in the report by either clicking on the pages listed below, or by using the keyword search tool below to find specific information within the annual report.-
 1
1 -
2
-
3
-
4
-
5
-
6
-
7
-
8
-
9
-
10
-
11
-
12
-
13
-
14
-
15
-
16
-
17
-
18
-
19
-
20
-
21
-
22
-
23
-
24
-
25
-
26
-
27
-
28
-
29
-
30
-
31
-
32
-
33
-
34
-
35
-
36
-
37
-
38
-
39
-
40
-
41
-
42
-
43
-
44
-
45
-
46
-
47
-
 48
48 -
 49
49 -
 50
50 -
 51
51 -
 52
52 -
 53
53 -
 54
54 -
 55
55 -
 56
56 -
 57
57 -
 58
58 -
 59
59 -
 60
60 -
 61
61 -
 62
62 -
 63
63 -
 64
64 -
 65
65 -
 66
66 -
 67
67 -
 68
68 -
69
-
70
-
71
-
72
-
73
-
74
-
75
-
76
-
77
-
78
-
79
-
80
-
81
-
82
-
83
-
84
-
85
-
86
-
87
-
88
-
89
-
90
-
91
-
92
-
93
-
94
-
95
-
96
-
97
-
98
-
99
-
100
-
101
-
102
-
103
-
104
-
105
-
106
-
107
-
108
-
109
-
110
-
111
-
112
-
113
-
114
-
115
-
116
-
117
-
118
-
119
-
120
-
121
-
122
-
123
-
124
-
125
-
126
-
127
-
128
 |
 |
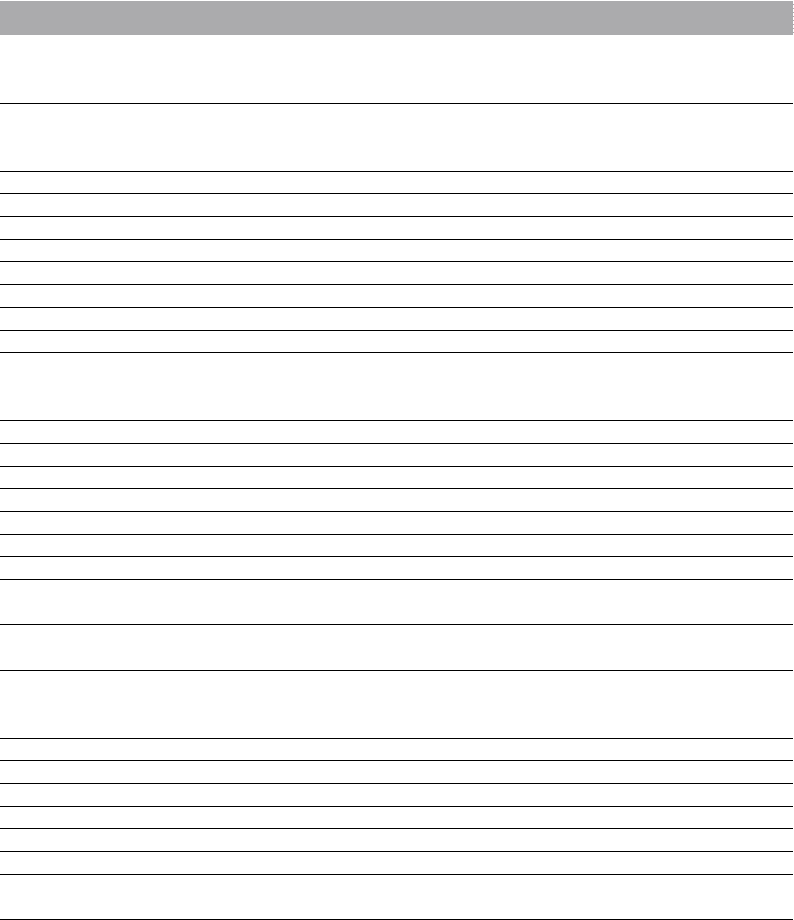
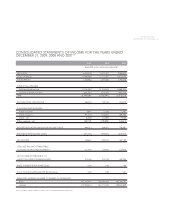
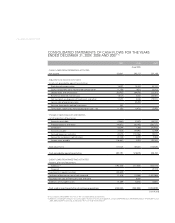
> 56 | ANNUAL REPORT 2009
CONSOLIDATED STATEMENTS OF CASH FLOWS FOR THE YEARS
ENDED DECEMBER 31, 2009, 2008 AND 2007 (*)
2009 2008 2007
(Euro/000)
CASH FLOWS FROM OPERATING ACTIVITIES
Net income 326,867 395,213 507,180
Adjustments to reconcile net income
to net cash provided by operating activitities:
Stock-based compensation 16,291 10,424 42,121
Excess tax benefits from stock-based compensation (1,156) (631) (6,313)
Depreciation and amortization 285,923 264,938 232,813
Benefit for deferred income taxes 18,123 4,858 (45,037)
Net loss (gain) on disposals of fixed assets and other 11,231 2,048 (19,337)
Loss on sale of promissory note 23,204
Earnings from equity method investment 951
Termination indemnities matured during the year - net (1,350) (1,472) (3,595)
Changes in operating assets and liabilities,
net of acquisition of businesses:
Accounts receivable 25,660 27,875 (55,707)
Prepaid expenses and other 140,872 (26,145) (220,727)
Inventories 46,544 1,368 (41,916)
Accounts payable 27,405 (19,393) 32,989
Accrued expenses and other 20,235 (110,386) (9,433)
Accrual for customers' right of return (3,723) 4,090 9,855
Income taxes payable (16,681) 2,903 (92,142)
Total adjustments 570,324 183,681 (176,429)
Cash provided by operating activities 897,191 578,895 330,751
CASH FLOWS FROM INVESTING ACTIVITIES
Property, plant and equipment:
Additions (1) (192,454) (311,540) (322,770)
Disposals 29,700
Investments in equity investees (20,683)
Purchases of businesses net of cash acquired (7,518) (13,288) (1,491,086)
Proceeds from sale of Promissory note and other 6,880
Additions of intangible assets (3,389) (4,636) (3,883)
Cash used in investing activities of continuing operations (224,044) (322,584) (1,788,039)
(continued)
(*) In accordance with US GAAP. See notes to the consolidated financial statements.
(1) Additions, excluding the change in accounts payable related to Property and equipment, are Euro 200,409,000, Euro 296,436,000 and Euro 334,769,000 for years
2009, 2008 and 2007 respectively, as indicated in Note 13 "Segment Information".