LensCrafters 2009 Annual Report Download - page 59
Download and view the complete annual report
Please find page 59 of the 2009 LensCrafters annual report below. You can navigate through the pages in the report by either clicking on the pages listed below, or by using the keyword search tool below to find specific information within the annual report.-
 1
1 -
2
-
3
-
4
-
5
-
6
-
7
-
8
-
9
-
10
-
11
-
12
-
13
-
14
-
15
-
16
-
17
-
18
-
19
-
20
-
21
-
22
-
23
-
24
-
25
-
26
-
27
-
28
-
29
-
30
-
31
-
32
-
33
-
34
-
35
-
36
-
37
-
38
-
39
-
40
-
41
-
42
-
43
-
44
-
45
-
46
-
47
-
48
-
 49
49 -
 50
50 -
 51
51 -
 52
52 -
 53
53 -
 54
54 -
 55
55 -
 56
56 -
 57
57 -
 58
58 -
 59
59 -
 60
60 -
 61
61 -
 62
62 -
 63
63 -
 64
64 -
 65
65 -
 66
66 -
 67
67 -
 68
68 -
 69
69 -
70
-
71
-
72
-
73
-
74
-
75
-
76
-
77
-
78
-
79
-
80
-
81
-
82
-
83
-
84
-
85
-
86
-
87
-
88
-
89
-
90
-
91
-
92
-
93
-
94
-
95
-
96
-
97
-
98
-
99
-
100
-
101
-
102
-
103
-
104
-
105
-
106
-
107
-
108
-
109
-
110
-
111
-
112
-
113
-
114
-
115
-
116
-
117
-
118
-
119
-
120
-
121
-
122
-
123
-
124
-
125
-
126
-
127
-
128
 |
 |

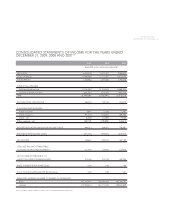
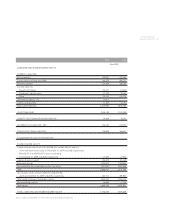
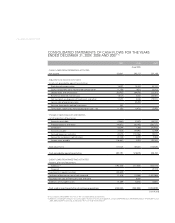
CONSOLIDATED
STATEMENTS OF CASH FLOWS | 57 <
2009 2008 2007
(Euro/000)
CASH FLOWS FROM FINANCING ACTIVITIES
Long-term debt:
Proceeds 987,738 995,709 2,145,428
Repayments (1,214,976) (1,005,453) (675,834)
Repayment of acquired lines of credit (166,577)
(Decrease) increase in overdraft balances (283,932) (30,570) 282,280
Sale of treasury shares 3,169
Exercise of stock options 11,498 7,126 26,642
Excess tax benefi t from stock-based compensation 1,156 631 6,313
Dividends (103,484) (223,617) (191,077)
Cash (used in)/provided by fi nancing activities of continuing
operations (598,831) (256,174) 1,427,174
INCREASE/(DECREASE) IN CASH AND CASH EQUIVALENTS 74,315 137 (30,114)
CASH AND EQUIVALENTS, BEGINNING OF YEAR 288,450 302,894 339,122
Effect of exchange rate changes on cash and cash equivalents 17,315 (14,582) (6,114)
CASH AND EQUIVALENTS, END OF YEAR 380,081 288,450 302,894
SUPPLEMENTAL DISCLOSURE OF CASH
FLOWS INFORMATION
Cash paid during the year for interest 94,095 121,181 73,202
Cash paid during the year for income taxes 70,839 266,104 454,062
Property and equipment purchases in accounts payable 19,671 11,716 26,820
Acquisition of businesses:
Fair value of assets acquired 9,308 545,129