LensCrafters 2009 Annual Report Download - page 89
Download and view the complete annual report
Please find page 89 of the 2009 LensCrafters annual report below. You can navigate through the pages in the report by either clicking on the pages listed below, or by using the keyword search tool below to find specific information within the annual report.-
 1
1 -
2
-
3
-
4
-
5
-
6
-
7
-
8
-
9
-
10
-
11
-
12
-
13
-
14
-
15
-
16
-
17
-
18
-
19
-
20
-
21
-
22
-
23
-
24
-
25
-
26
-
27
-
28
-
29
-
30
-
31
-
32
-
33
-
34
-
35
-
36
-
37
-
38
-
39
-
40
-
41
-
42
-
43
-
44
-
45
-
46
-
47
-
48
-
49
-
50
-
51
-
52
-
53
-
54
-
55
-
56
-
57
-
58
-
59
-
60
-
61
-
62
-
63
-
64
-
65
-
66
-
67
-
68
-
69
-
70
-
71
-
72
-
73
-
74
-
75
-
76
-
77
-
78
-
 79
79 -
 80
80 -
 81
81 -
 82
82 -
 83
83 -
 84
84 -
 85
85 -
 86
86 -
 87
87 -
 88
88 -
 89
89 -
 90
90 -
 91
91 -
 92
92 -
 93
93 -
 94
94 -
 95
95 -
 96
96 -
 97
97 -
 98
98 -
 99
99 -
100
-
101
-
102
-
103
-
104
-
105
-
106
-
107
-
108
-
109
-
110
-
111
-
112
-
113
-
114
-
115
-
116
-
117
-
118
-
119
-
120
-
121
-
122
-
123
-
124
-
125
-
126
-
127
-
128
 |
 |

NOTES TO CONSOLIDATED
FINANCIAL STATEMENTS | 87 <
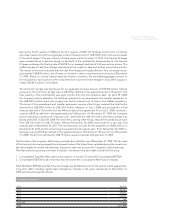
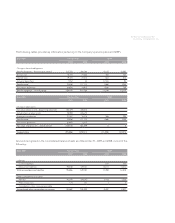
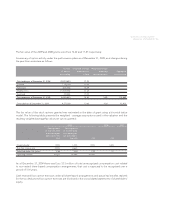
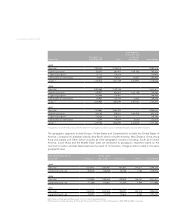
Asset category Fair Value Measurements at December 31, 2009
Total
Quoted Prices in Active
Markets for Identical
Assets (Level 1)
Signifi cant
Observable Inputs
(Level 2)
Signifi cant
Unobservable
Inputs (Level 3)
Equity Securities:
US large cap growth 44,361 44,361 - -
US large cap value 41,910 41,910 - -
Investment Funds:
US Small Cap Mutual Fund (a) 21,613 21,613 - -
International Collective Trust (b) 30,724 - 30,724 -
Fixed Income Mutual Fund (c) 81,274 81,274 - -
Money Market Funds (d) 18,188 18,188 -
Limited Partnerships (e) 98 - - 98
Total 238,168 189,158 48,912 98
(a) This category comprises a small cap US equity exchange-traded fund not actively managed that tracks
the Russell 2000 Stock Index.
(b) This category comprises investment in an equity fund that invests in international core, large, and mid
cap stocks with no more than 35% of the fund invested in emerging markets.
(c) This category comprises investment in a fixed income fund that invests in a diversified portfolio of fixed
income instruments such as U.S Treasuries, TIPS, investment grade corporate bonds, mortgage backed
securities, and investment grade corporate securities.
(d) This category comprises investments in money market funds with an amortized net asset value of $1.00
per share.
(e) This category includes two limited partnerships that invest in securities which are not publicly traded.
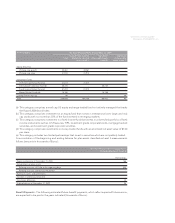
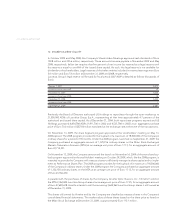
A reconciliation of the beginning and ending balance for plan assets classifi ed as Level 3 measurements
follows (amounts in thousands of Euros):
Fair Value Measurement Using Signifi cant
Unobservable Inputs (Level 3)
Partnerships
Beginning balance at December 31, 2008 166
Actual return on plan assets:
Relating to assets still held at the reporting date (65)
Relating to assets sold during the period -
Purchases, sales, and settlements -
Transfers in and/or out of Level 3 -
Translation difference (3)
Ending balance at December 31, 2009 98
Benefi t Payments - The following estimated future benefi t payments, which refl ect expected future service,
are expected to be paid in the years indicated (thousands of Euros):