LensCrafters 2009 Annual Report Download - page 87
Download and view the complete annual report
Please find page 87 of the 2009 LensCrafters annual report below. You can navigate through the pages in the report by either clicking on the pages listed below, or by using the keyword search tool below to find specific information within the annual report.-
 1
1 -
2
-
3
-
4
-
5
-
6
-
7
-
8
-
9
-
10
-
11
-
12
-
13
-
14
-
15
-
16
-
17
-
18
-
19
-
20
-
21
-
22
-
23
-
24
-
25
-
26
-
27
-
28
-
29
-
30
-
31
-
32
-
33
-
34
-
35
-
36
-
37
-
38
-
39
-
40
-
41
-
42
-
43
-
44
-
45
-
46
-
47
-
48
-
49
-
50
-
51
-
52
-
53
-
54
-
55
-
56
-
57
-
58
-
59
-
60
-
61
-
62
-
63
-
64
-
65
-
66
-
67
-
68
-
69
-
70
-
71
-
72
-
73
-
74
-
75
-
76
-
 77
77 -
 78
78 -
 79
79 -
 80
80 -
 81
81 -
 82
82 -
 83
83 -
 84
84 -
 85
85 -
 86
86 -
 87
87 -
 88
88 -
 89
89 -
 90
90 -
 91
91 -
 92
92 -
 93
93 -
 94
94 -
 95
95 -
 96
96 -
 97
97 -
98
-
99
-
100
-
101
-
102
-
103
-
104
-
105
-
106
-
107
-
108
-
109
-
110
-
111
-
112
-
113
-
114
-
115
-
116
-
117
-
118
-
119
-
120
-
121
-
122
-
123
-
124
-
125
-
126
-
127
-
128
 |
 |
NOTES TO CONSOLIDATED
FINANCIAL STATEMENTS | 85 <
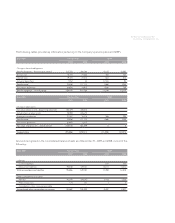
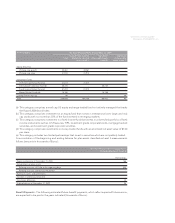
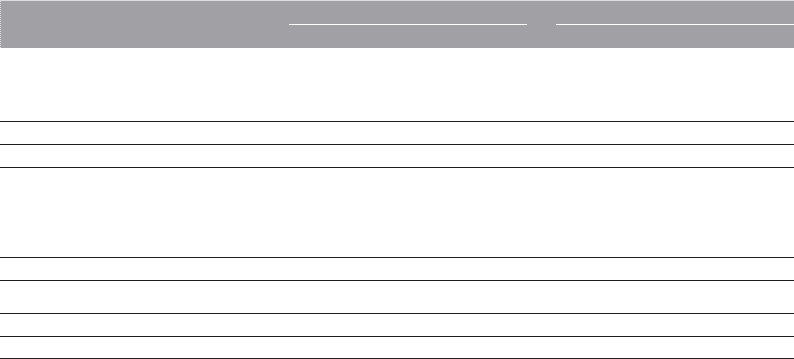
Assumptions Pension Plans SERP
2009 2008 2009 2008
Weighted-average assumption used to
determine benefi t obligations:
Discount rate 6.15% 6.30% 6.15% 6.30%
Rate of compensation increase 4%/3%/1% 6%/5%/4% 4%/3%/1% 6%/5%/4%
Weighted-average assumption used to
determine net periodic benefi t cost for
years ended December 31, 2009 and 2008:
Discount rate 6.15% 6.50% 6.15% 6.50%
Expected long-term return on plan assets 8.00% 8.00% N/A N/A
Rate of compensation increase 6%/5%/4% 6%/5%/4% 6%/5%/4% 6%/5%/4%
Mortality table RP-2000 RP-2000 RP-2000 RP-2000
The Company’s assumed discount rate is developed using a third party yield curve derived from non-
callable bonds of at least an Aa rating by Moody’s Investors Service or at least an AA rating by Standard
& Poor’s. Each bond issue is required to have at least US$ 250 million par outstanding. The yield curve
compares the future expected benefi t payments of the Lux Plan to these bond yields to determine an
equivalent discount rate.
The Company uses an assumption for salary increases based on a graduated approach of historical experi-
ence. The Company’s experience shows salary increases that typically vary by age.
Our actuaries use the RP-2000 Mortality Table, which includes death rates for each age, in estimating the
amount of pension benefi ts that will become payable.
For 2009, the Company’s long-term rate of return assumption on the pension plan’s assets was 8.00%. In de-
veloping this assumption, the Company used a variety of analysis tools. The Company analyzed historical
rates of return for each asset category over various periods of time. In addition, the Company considered
input from its third-party pension asset managers, investment consultants, and plan actuaries, including
their review of asset class return expectations and long-term infl ation assumptions. The resulting assump-
tion was also benchmarked against the assumptions used by other US corporations as refl ected in several
surveys.
Plan Assets - The Lux Plan’s investment policy is to invest plan assets in a manner to ensure over a long-
term investment horizon that the Lux Plan is adequately funded; maximize investment return within reason-
able and prudent levels of risk; and maintain suffi cient liquidity to make timely benefi t and administrative
expense payments. This investment policy was developed to provide the framework within which the
fi duciary’s investment decisions are made, establish standards to measure the investment manager’s and
investment consultant’s performance, outline the roles and responsibilities of the various parties involved,
and describe the ongoing review process. The investment policy identifi es target asset allocations for the
plan’s assets at 40% Large Cap US Equity, 10% Small Cap US Equity, 15% International Equity, and 35%
Fixed Income Securities, but an allowance is provided for a range of allocations to these categories as
described in the table below.