LensCrafters 2009 Annual Report Download - page 115
Download and view the complete annual report
Please find page 115 of the 2009 LensCrafters annual report below. You can navigate through the pages in the report by either clicking on the pages listed below, or by using the keyword search tool below to find specific information within the annual report.-
 1
1 -
2
-
3
-
4
-
5
-
6
-
7
-
8
-
9
-
10
-
11
-
12
-
13
-
14
-
15
-
16
-
17
-
18
-
19
-
20
-
21
-
22
-
23
-
24
-
25
-
26
-
27
-
28
-
29
-
30
-
31
-
32
-
33
-
34
-
35
-
36
-
37
-
38
-
39
-
40
-
41
-
42
-
43
-
44
-
45
-
46
-
47
-
48
-
49
-
50
-
51
-
52
-
53
-
54
-
55
-
56
-
57
-
58
-
59
-
60
-
61
-
62
-
63
-
64
-
65
-
66
-
67
-
68
-
69
-
70
-
71
-
72
-
73
-
74
-
75
-
76
-
77
-
78
-
79
-
80
-
81
-
82
-
83
-
84
-
85
-
86
-
87
-
88
-
89
-
90
-
91
-
92
-
93
-
94
-
95
-
96
-
97
-
98
-
99
-
100
-
101
-
102
-
103
-
104
-
 105
105 -
 106
106 -
 107
107 -
 108
108 -
 109
109 -
 110
110 -
 111
111 -
 112
112 -
 113
113 -
 114
114 -
 115
115 -
 116
116 -
 117
117 -
 118
118 -
 119
119 -
 120
120 -
 121
121 -
 122
122 -
 123
123 -
 124
124 -
 125
125 -
126
-
127
-
128
 |
 |

ANNEXES | 113 <
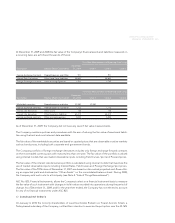
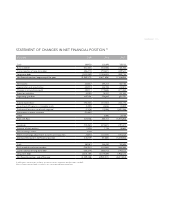
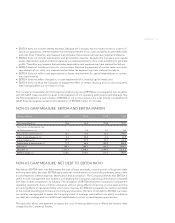
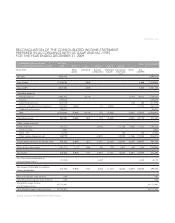
STATEMENT OF CHANGES IN NET FINANCIAL POSITION (*)
(Euro 000) 2009 2008 2007(1)
Cash 288,450 302,894 339,122
Bank overdraft (432,465) (455,588) (168,358)
Current portion of long-term debt (286,213) (792,617) (359,527)
Long-term debt (2,519,289) (1,926,523) (959,735)
Net financial position, beginning of the year (2,949,517) (2,871,834) (1,148,498)
Net income 326,867 395,213 507,180
Depreciation and amortization 285,923 264,938 232,813
Change in net working capital 240,311 (119,688) (377,082)
Provision and other 44,090 38,431 (32,160)
Operating cash flow 897,191 578,895 330,751
Capital expenditure (192,454) (311,540) (322,770)
(Investments)/Disposal in intangible assets (3,389) (4,636) (3,883)
Purchase of business net of cash acquired (7,518) (13,288) (1,491,086)
Investments in equity investees (20,683)
Other 6,880 29,700
Free cash flow 673,146 256,311 (1,457,288)
Dividends (103,484) (223,617) (191,077)
Exercise of stock options 11,498 7,126 26,642
Sale of treasury shares 3,169
Effect of exchange adjustments to net financial position 25,850 (117,503) (101,612)
Decrease/(Increase) in net financial position 610,179 (77,683) (1,723,336)
Cash 380,081 288,450 302,894
Bank overdraft and notes payable (148,951) (432,465) (455,588)
Current portion of long-term debt (166,279) (286,213) (792,617)
Long-term debt (2,404,189) (2,519,289) (1,926,523)
Net financial position, end of the year (2,339,338) (2,949,517) (2,871,834)
(1) 2007 figures include results of Oakley operations from the acquisition date (November 14, 2007).
(*) In accordance with US GAAP. See notes to the consolidated financial statements.