Lenovo 2012 Annual Report Download - page 72
Download and view the complete annual report
Please find page 72 of the 2012 Lenovo annual report below. You can navigate through the pages in the report by either clicking on the pages listed below, or by using the keyword search tool below to find specific information within the annual report.-
 1
1 -
2
-
3
-
4
-
5
-
6
-
7
-
8
-
9
-
10
-
11
-
12
-
13
-
14
-
15
-
16
-
17
-
18
-
19
-
20
-
21
-
22
-
23
-
24
-
25
-
26
-
27
-
28
-
29
-
30
-
31
-
32
-
33
-
34
-
35
-
36
-
37
-
38
-
39
-
40
-
41
-
42
-
43
-
44
-
45
-
46
-
47
-
48
-
49
-
50
-
51
-
52
-
53
-
54
-
55
-
56
-
57
-
58
-
59
-
60
-
61
-
 62
62 -
 63
63 -
 64
64 -
 65
65 -
 66
66 -
 67
67 -
 68
68 -
 69
69 -
 70
70 -
 71
71 -
 72
72 -
 73
73 -
 74
74 -
 75
75 -
 76
76 -
 77
77 -
 78
78 -
 79
79 -
 80
80 -
 81
81 -
 82
82 -
83
-
84
-
85
-
86
-
87
-
88
-
89
-
90
-
91
-
92
-
93
-
94
-
95
-
96
-
97
-
98
-
99
-
100
-
101
-
102
-
103
-
104
-
105
-
106
-
107
-
108
-
109
-
110
-
111
-
112
-
113
-
114
-
115
-
116
-
117
-
118
-
119
-
120
-
121
-
122
-
123
-
124
-
125
-
126
-
127
-
128
-
129
-
130
-
131
-
132
-
133
-
134
-
135
-
136
-
137
-
138
-
139
-
140
-
141
-
142
-
143
-
144
-
145
-
146
-
147
-
148
-
149
-
150
-
151
-
152
-
153
-
154
-
155
-
156
-
157
-
158
-
159
-
160
-
161
-
162
-
163
-
164
-
165
-
166
-
167
-
168
-
169
-
170
-
171
-
172
-
173
-
174
-
175
-
176
-
177
-
178
-
179
-
180
 |
 |

2011/12 Annual Report Lenovo Group Limited
70
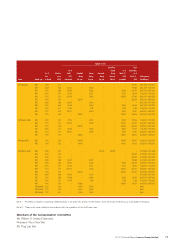
COMPENSATION COMMITTEE REPORT
Number of units
Name Award type
Fiscal
Year
of Award
Effective
price
(HK$)
As at
April 1,
2011
(Unvested)
Awarded
during
the year
Vested
during
the year
Exercised
during
the year
Cancelled/
lapsed
during
the year
(Note 2)
As at
March 31,
2012
(unvested)
Total
outstanding
as at
March 31,
2012
Vesting period
(mm.dd.yyyy)
Dr. Wu Yibing SAR 09/10 3.88 175,864 –87,932 – – 87,932 263,796 08.07.2010 – 08.07.2012
SAR 09/10 4.47 25,442 –12,721 – – 12,721 38,163 11.30.2010 – 11.30.2012
SAR 10/11 4.59 237,001 –79,000 – – 158,001 237,001 08.20.2011 – 08.20.2013
SAR 11/12 4.56 –323,000 –––323,000 323,000 08.19.2012 – 08.19.2014
RSU 09/10 3.88 79,938 –39,969 – – 39,969 39,969 08.07.2010 – 08.07.2012
RSU 09/10 4.47 11,565 –5,782 – – 5,783 5,783 11.30.2010 – 11.30.2012
RSU 10/11 4.59 118,501 –39,500 – – 79,001 79,001 08.20.2011 – 08.20.2013
RSU 11/12 4.56 –153,810 –––153,810 153,810 08.19.2012 – 08.19.2014
Professor Woo Chia-Wei SAR 05/06 3.15 –––564,000 261,457 – – 05.01.2006 – 05.01.2008
SAR 06/07 2.99 –––390,000 161,398 – – 06.01.2007 – 06.01.2009
SAR 07/08 3.94 ––––––297,000 06.01.2008 – 06.01.2010
SAR 08/09 5.88 65,327 –65,327 – – – 195,980 06.01.2009 – 06.01.2011
SAR 09/10 3.88 175,864 –87,932 – – 87,932 263,796 08.07.2010 – 08.07.2012
SAR 09/10 4.47 25,442 –12,721 – – 12,721 38,163 11.30.2010 – 11.30.2012
SAR 10/11 4.59 237,001 –79,000 – – 158,001 237,001 08.20.2011 – 08.20.2013
SAR 11/12 4.56 –323,000 –––323,000 323,000 08.19.2012 – 08.19.2014
RSU 08/09 5.88 26,130 –26,130 – – – – 06.01.2009 – 06.01.2011
RSU 09/10 3.88 79,938 –39,969 – – 39,969 39,969 08.07.2010 – 08.07.2012
RSU 09/10 4.47 11,565 –5,782 – – 5,783 5,783 11.30.2010 – 11.30.2012
RSU 10/11 4.59 118,501 –39,500 – – 79,001 79,001 08.20.2011 – 08.20.2013
RSU 11/12 4.56 –153,810 –––153,810 153,810 08.19.2012 – 08.19.2014
RSU 10/11 4.30 –36,047 36,047 – – – – Note 1
RSU 11/12 4.56 –34,180 34,180 – – – – Note 1
RSU 11/12 6.72 –23,080 23,080 – – – – Note 1
Mr. Ting Lee Sen SAR 05/06 3.15 –––564,000 317,534 – – 05.01.2006 – 05.01.2008
SAR 06/07 2.99 ––––––390,000 06.01.2007 – 06.01.2009
SAR 07/08 3.94 ––––––297,000 06.01.2008 – 06.01.2010
SAR 08/09 5.88 65,327 –65,327 –––195,980 06.01.2009 – 06.01.2011
SAR 09/10 3.88 175,864 –87,932 – – 87,932 263,796 08.07.2010 – 08.07.2012
SAR 09/10 4.47 25,442 –12,721 – – 12,721 38,163 11.30.2010 – 11.30.2012
SAR 10/11 4.59 237,001 –79,000 – – 158,001 237,001 08.20.2011 – 08.20.2013
SAR 11/12 4.56 –323,000 –––323,000 323,000 08.19.2012 – 08.19.2014
RSU 08/09 5.88 26,130 –26,130 – – – – 06.01.2009 – 06.01.2011
RSU 09/10 3.88 79,938 –39,969 – – 39,969 39,969 08.07.2010 – 08.07.2012
RSU 09/10 4.47 11,565 –5,782 – – 5,783 5,783 11.30.2010 – 11.30.2012
RSU 10/11 4.59 118,501 –39,500 – – 79,001 79,001 08.20.2011 – 08.20.2013
RSU 11/12 4.56 –153,810 –––153,810 153,810 08.19.2012 – 08.19.2014