Lenovo 2012 Annual Report Download - page 168
Download and view the complete annual report
Please find page 168 of the 2012 Lenovo annual report below. You can navigate through the pages in the report by either clicking on the pages listed below, or by using the keyword search tool below to find specific information within the annual report.-
 1
1 -
2
-
3
-
4
-
5
-
6
-
7
-
8
-
9
-
10
-
11
-
12
-
13
-
14
-
15
-
16
-
17
-
18
-
19
-
20
-
21
-
22
-
23
-
24
-
25
-
26
-
27
-
28
-
29
-
30
-
31
-
32
-
33
-
34
-
35
-
36
-
37
-
38
-
39
-
40
-
41
-
42
-
43
-
44
-
45
-
46
-
47
-
48
-
49
-
50
-
51
-
52
-
53
-
54
-
55
-
56
-
57
-
58
-
59
-
60
-
61
-
62
-
63
-
64
-
65
-
66
-
67
-
68
-
69
-
70
-
71
-
72
-
73
-
74
-
75
-
76
-
77
-
78
-
79
-
80
-
81
-
82
-
83
-
84
-
85
-
86
-
87
-
88
-
89
-
90
-
91
-
92
-
93
-
94
-
95
-
96
-
97
-
98
-
99
-
100
-
101
-
102
-
103
-
104
-
105
-
106
-
107
-
108
-
109
-
110
-
111
-
112
-
113
-
114
-
115
-
116
-
117
-
118
-
119
-
120
-
121
-
122
-
123
-
124
-
125
-
126
-
127
-
128
-
129
-
130
-
131
-
132
-
133
-
134
-
135
-
136
-
137
-
138
-
139
-
140
-
141
-
142
-
143
-
144
-
145
-
146
-
147
-
148
-
149
-
150
-
151
-
152
-
153
-
154
-
155
-
156
-
157
-
 158
158 -
 159
159 -
 160
160 -
 161
161 -
 162
162 -
 163
163 -
 164
164 -
 165
165 -
 166
166 -
 167
167 -
 168
168 -
 169
169 -
 170
170 -
 171
171 -
 172
172 -
 173
173 -
 174
174 -
 175
175 -
 176
176 -
 177
177 -
 178
178 -
179
-
180
 |
 |

2011/12 Annual Report Lenovo Group Limited
166
NOTES TO THE FINANCIAL STATEMENTS
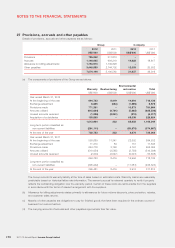
33 Commitments (continued)
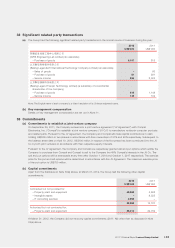
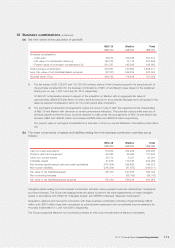
(c) Commitments under operating leases
The future aggregate minimum lease payments in respect of land and buildings under non-cancelable operating leases
of the Group are as follows:
2012 2011
US$’000 US$’000
Not later than one year 51,473 36,267
Later than one year but not later than five years 95,452 94,409
Later than five years 38,056 44,268
184,981 174,944
At March 31, 2012, the Company did not have any operating lease commitments (2011: Nil).
34 Contingent liabilities
(a) The Group, in the ordinary course of its business, is involved in various claims, suits, investigations, and legal
proceedings that arise from time to time. Although the Group does not expect that the outcome in any of these other
legal proceedings, individually or collectively, will have a material adverse effect on its financial position or results of
operations, litigation is inherently unpredictable. Therefore, the Group could incur judgments or enter into settlements of
claims that could adversely affect its operating results or cash flows in a particular period.
(b) The Company has executed guarantees with respect to bank facilities made available to its subsidiaries. At March 31,
2012, such facilities granted and utilized amounted to approximately US$2,985,823,000 and US$1,414,442,000 (2011:
US$2,146,903,000 and US$1,249,895,000) respectively.
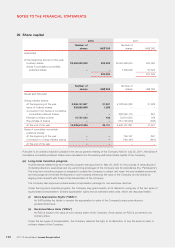
35 Notes to the consolidated cash flow statement
(a) Reconciliation of profit before taxation to net cash generated from operations
2012 2011
US$’000 US$’000
Profit before taxation 582,443 357,751
Share of losses of associates and jointly controlled entities 851 225
Finance income (42,693) (24,927)
Finance costs 43,484 49,176
Depreciation of property, plant and equipment and
amortization of prepaid lease payments 77,721 81,856
Amortization of intangible assets and share-based compensation 164,102 135,659
Loss/(gain) on disposal of property, plant and equipment 1,505 (191)
Loss on disposal of construction-in-progress 61,415
Loss/(gain) on disposal of intangible assets 1,113 (14)
Gain on disposal of subsidiaries and an associate (50) (13,015)
Dividend income (95) (93)
Gain on disposal of financial instruments (7,274) (326)
(Increase)/decrease in inventories (13,587) 75,185
Increase in trade receivables, notes receivable, deposits,
prepayments and other receivables (1,322,485) (1,238,985)
Increase in trade payables, notes payable, provisions,
accruals and other payables 2,724,863 1,761,769
Effect of foreign exchange rate changes (83,139) (96,388)
Net cash generated from operations 2,126,765 1,089,097