Lenovo 2012 Annual Report Download - page 162
Download and view the complete annual report
Please find page 162 of the 2012 Lenovo annual report below. You can navigate through the pages in the report by either clicking on the pages listed below, or by using the keyword search tool below to find specific information within the annual report.-
 1
1 -
2
-
3
-
4
-
5
-
6
-
7
-
8
-
9
-
10
-
11
-
12
-
13
-
14
-
15
-
16
-
17
-
18
-
19
-
20
-
21
-
22
-
23
-
24
-
25
-
26
-
27
-
28
-
29
-
30
-
31
-
32
-
33
-
34
-
35
-
36
-
37
-
38
-
39
-
40
-
41
-
42
-
43
-
44
-
45
-
46
-
47
-
48
-
49
-
50
-
51
-
52
-
53
-
54
-
55
-
56
-
57
-
58
-
59
-
60
-
61
-
62
-
63
-
64
-
65
-
66
-
67
-
68
-
69
-
70
-
71
-
72
-
73
-
74
-
75
-
76
-
77
-
78
-
79
-
80
-
81
-
82
-
83
-
84
-
85
-
86
-
87
-
88
-
89
-
90
-
91
-
92
-
93
-
94
-
95
-
96
-
97
-
98
-
99
-
100
-
101
-
102
-
103
-
104
-
105
-
106
-
107
-
108
-
109
-
110
-
111
-
112
-
113
-
114
-
115
-
116
-
117
-
118
-
119
-
120
-
121
-
122
-
123
-
124
-
125
-
126
-
127
-
128
-
129
-
130
-
131
-
132
-
133
-
134
-
135
-
136
-
137
-
138
-
139
-
140
-
141
-
142
-
143
-
144
-
145
-
146
-
147
-
148
-
149
-
150
-
151
-
 152
152 -
 153
153 -
 154
154 -
 155
155 -
 156
156 -
 157
157 -
 158
158 -
 159
159 -
 160
160 -
 161
161 -
 162
162 -
 163
163 -
 164
164 -
 165
165 -
 166
166 -
 167
167 -
 168
168 -
 169
169 -
 170
170 -
 171
171 -
 172
172 -
173
-
174
-
175
-
176
-
177
-
178
-
179
-
180
 |
 |

2011/12 Annual Report Lenovo Group Limited
160
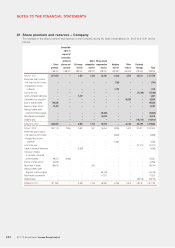
NOTES TO THE FINANCIAL STATEMENTS
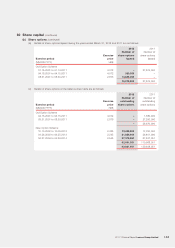
30 Share capital (continued)
(b) Share options (continued)
2012 2011
Number of
outstanding
share options
Number of
outstanding
share options
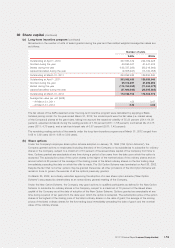
At the beginning of the year 139,638,051 219,926,551
Exercised during the year (ii) (31,761,000) (52,614,500)
Lapsed during the year (iii) (15,216,000) (27,674,000)
At the end of the year (iv) 92,661,051 139,638,051
(i) No share options were granted or cancelled by the Company during the years ended March 31, 2011 and 2012.
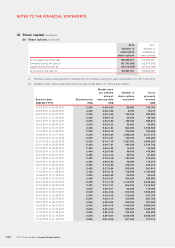
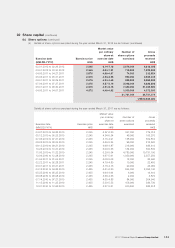
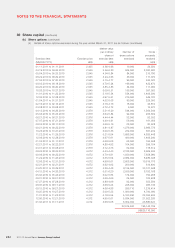
(ii) Details of share options exercised during the year ended March 31, 2012 are as follows:
Exercise date Exercise price
Market value
per ordinary
share at
exercise date
Number of
share options
exercised
Gross
proceeds
received
(MM.DD.YYYY) HK$ HK$ HK$
04.13.2011 to 04.26.2011 2.245 4.46-4.55 52,000 116,740
05.23.2011 to 05.23.2011 2.245 4.22-4.22 6,000 13,470
06.01.2011 to 06.27.2011 2.245 4.20-4.43 102,000 228,990
07.18.2011 to 07.26.2011 2.245 4.68-5.19 44,000 98,780
08.01.2011 to 08.31.2011 2.245 4.63-5.22 126,000 282,870
09.19.2011 to 09.28.2011 2.245 5.02-5.23 42,000 94,290
10.11.2011 to 10.31.2011 2.245 5.23-5.64 500,000 1,122,500
11.01.2011 to 11.28.2011 2.245 5.22-5.78 314,000 704,930
12.05.2011 to 12.07.2011 2.245 5.49-5.60 1,206,000 2,707,470
01.09.2012 to 01.31.2012 2.245 5.81-6.21 104,000 233,480
02.01.2012 to 02.29.2012 2.245 6.14-7.18 1,597,000 3,585,265
03.01.2012 to 03.30.2012 2.245 6.64-7.31 452,000 1,014,740
04.18.2011 to 04.20.2011 2.435 4.43-4.46 14,000 34,090
05.04.2011 to 05.31.2011 2.435 4.22-4.58 56,000 136,360
06.01.2011 to 06.01.2011 2.435 4.43-4.43 36,000 87,660
07.11.2011 to 07.27.2011 2.435 4.70-5.15 130,000 316,550
08.02.2011 to 08.31.2011 2.435 4.96-5.22 46,000 112,010
09.21.2011 to 09.28.2011 2.435 5.16-5.23 166,000 404,210
10.11.2011 to 10.26.2011 2.435 5.27-5.64 206,000 501,610
11.01.2011 to 11.29.2011 2.435 5.34-5.78 716,000 1,743,460
12.06.2011 to 12.14.2011 2.435 5.48-5.55 24,000 58,440
01.10.2012 to 01.31.2012 2.435 5.81-6.21 134,000 326,290
02.01.2012 to 02.29.2012 2.435 6.14-7.18 1,412,000 3,438,220
03.01.2012 to 03.30.2012 2.435 6.64-7.31 664,000 1,616,840
04.06.2011 to 04.27.2011 2.545 4.39-4.57 68,000 173,060
05.03.2011 to 05.31.2011 2.545 4.23-4.58 610,000 1,552,450
06.01.2011 to 06.28.2011 2.545 4.20-4.43 172,000 437,740
07.04.2011 to 07.27.2011 2.545 4.64-5.19 150,000 381,750
08.01.2011 to 08.31.2011 2.545 4.86-5.22 256,000 651,520
09.05.2011 to 09.21.2011 2.545 4.94-5.16 1,142,000 2,906,390
10.10.2011 to 10.31.2011 2.545 5.00-5.64 528,000 1,343,760
11.07.2011 to 11.29.2011 2.545 5.22-5.78 196,000 498,820
12.05.2011 to 12.14.2011 2.545 5.49-5.60 3,334,000 8,485,030
01.09.2012 to 01.18.2012 2.545 5.81-5.99 307,000 781,315