Lenovo 2012 Annual Report Download - page 154
Download and view the complete annual report
Please find page 154 of the 2012 Lenovo annual report below. You can navigate through the pages in the report by either clicking on the pages listed below, or by using the keyword search tool below to find specific information within the annual report.-
 1
1 -
2
-
3
-
4
-
5
-
6
-
7
-
8
-
9
-
10
-
11
-
12
-
13
-
14
-
15
-
16
-
17
-
18
-
19
-
20
-
21
-
22
-
23
-
24
-
25
-
26
-
27
-
28
-
29
-
30
-
31
-
32
-
33
-
34
-
35
-
36
-
37
-
38
-
39
-
40
-
41
-
42
-
43
-
44
-
45
-
46
-
47
-
48
-
49
-
50
-
51
-
52
-
53
-
54
-
55
-
56
-
57
-
58
-
59
-
60
-
61
-
62
-
63
-
64
-
65
-
66
-
67
-
68
-
69
-
70
-
71
-
72
-
73
-
74
-
75
-
76
-
77
-
78
-
79
-
80
-
81
-
82
-
83
-
84
-
85
-
86
-
87
-
88
-
89
-
90
-
91
-
92
-
93
-
94
-
95
-
96
-
97
-
98
-
99
-
100
-
101
-
102
-
103
-
104
-
105
-
106
-
107
-
108
-
109
-
110
-
111
-
112
-
113
-
114
-
115
-
116
-
117
-
118
-
119
-
120
-
121
-
122
-
123
-
124
-
125
-
126
-
127
-
128
-
129
-
130
-
131
-
132
-
133
-
134
-
135
-
136
-
137
-
138
-
139
-
140
-
141
-
142
-
143
-
 144
144 -
 145
145 -
 146
146 -
 147
147 -
 148
148 -
 149
149 -
 150
150 -
 151
151 -
 152
152 -
 153
153 -
 154
154 -
 155
155 -
 156
156 -
 157
157 -
 158
158 -
 159
159 -
 160
160 -
 161
161 -
 162
162 -
 163
163 -
 164
164 -
165
-
166
-
167
-
168
-
169
-
170
-
171
-
172
-
173
-
174
-
175
-
176
-
177
-
178
-
179
-
180
 |
 |

2011/12 Annual Report Lenovo Group Limited
152
NOTES TO THE FINANCIAL STATEMENTS
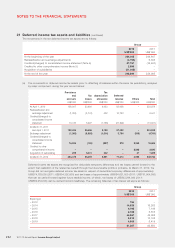
21 Deferred income tax assets and liabilities (continued)
The movements in the net deferred income tax assets are as follows:
Group
2012 2011
US$’000 US$’000
At the beginning of the year 234,005 244,647
Reclassification and exchange adjustments (4,753) 6,305
Credited/(charged) to consolidated income statement (Note 9) 67,757 (16,947)
Credited to other comprehensive income (Note 9) 2,895 –
Acquisition of subsidiaries (51,005) –
At the end of the year 248,899 234,005
(a) The movements in deferred income tax assets (prior to offsetting of balances within the same tax jurisdiction), analyzed
by major component, during the year are as follows:
Provisions
and
accruals
Tax
losses
Tax
depreciation
allowance
Deferred
revenue Others Total
US$’000 US$’000 US$’000 US$’000 US$’000 US$’000
At April 1, 2010 138,007 23,900 9,433 83,638 –254,978
Reclassification and
exchange adjustment (1,003) (3,741) 432 10,753 –6,441
Credited/(charged) to
consolidated income
statement 13,416 5,297 (1,735) (27,299) –(10,321)
At March 31, 2011
and April 1, 2011 150,420 25,456 8,130 67,092 –251,098
Exchange adjustment (1,245) (5,688) (1,014) 3,704 (518) (4,761)
Credited/(charged) to
consolidated income
statement 74,935 (100) (897) 278 2,249 76,465
Credited to other
comprehensive income – – – – 2,895 2,895
Acquisition of subsidiaries 269 6,431 342 –27 7,069
At March 31, 2012 224,379 26,099 6,561 71,074 4,653 332,766
Deferred income tax assets are recognized for deductible temporary differences and tax losses carried forward to the
extent that realization of the related tax benefit through the future taxable profits is probable. At March 31, 2012, the
Group did not recognize deferred income tax assets in respect of deductible temporary differences of approximately
US$574,183,000 (2011: US$504,352,000) and tax losses of approximately US$584,631,000 (2011: US$751,904,000)
that can be carried forward against future taxable income, of which, tax losses of US$503,244,000 (2011:
US$659,254,000) can be carried forward indefinitely. The remaining balances of tax losses will expire as follows:
Group
2012 2011
US$’000 US$’000
Expiring in
– 2012 754 –
– 2014 14,525 16,263
– 2015 6,795 7,146
– 2016 2,168 5,616
– 2017 44,067 42,098
– 2018 8,213 13,108
– 2019 4,865 8,419
81,387 92,650