Lenovo 2012 Annual Report Download - page 145
Download and view the complete annual report
Please find page 145 of the 2012 Lenovo annual report below. You can navigate through the pages in the report by either clicking on the pages listed below, or by using the keyword search tool below to find specific information within the annual report.-
 1
1 -
2
-
3
-
4
-
5
-
6
-
7
-
8
-
9
-
10
-
11
-
12
-
13
-
14
-
15
-
16
-
17
-
18
-
19
-
20
-
21
-
22
-
23
-
24
-
25
-
26
-
27
-
28
-
29
-
30
-
31
-
32
-
33
-
34
-
35
-
36
-
37
-
38
-
39
-
40
-
41
-
42
-
43
-
44
-
45
-
46
-
47
-
48
-
49
-
50
-
51
-
52
-
53
-
54
-
55
-
56
-
57
-
58
-
59
-
60
-
61
-
62
-
63
-
64
-
65
-
66
-
67
-
68
-
69
-
70
-
71
-
72
-
73
-
74
-
75
-
76
-
77
-
78
-
79
-
80
-
81
-
82
-
83
-
84
-
85
-
86
-
87
-
88
-
89
-
90
-
91
-
92
-
93
-
94
-
95
-
96
-
97
-
98
-
99
-
100
-
101
-
102
-
103
-
104
-
105
-
106
-
107
-
108
-
109
-
110
-
111
-
112
-
113
-
114
-
115
-
116
-
117
-
118
-
119
-
120
-
121
-
122
-
123
-
124
-
125
-
126
-
127
-
128
-
129
-
130
-
131
-
132
-
133
-
134
-
 135
135 -
 136
136 -
 137
137 -
 138
138 -
 139
139 -
 140
140 -
 141
141 -
 142
142 -
 143
143 -
 144
144 -
 145
145 -
 146
146 -
 147
147 -
 148
148 -
 149
149 -
 150
150 -
 151
151 -
 152
152 -
 153
153 -
 154
154 -
 155
155 -
156
-
157
-
158
-
159
-
160
-
161
-
162
-
163
-
164
-
165
-
166
-
167
-
168
-
169
-
170
-
171
-
172
-
173
-
174
-
175
-
176
-
177
-
178
-
179
-
180
 |
 |
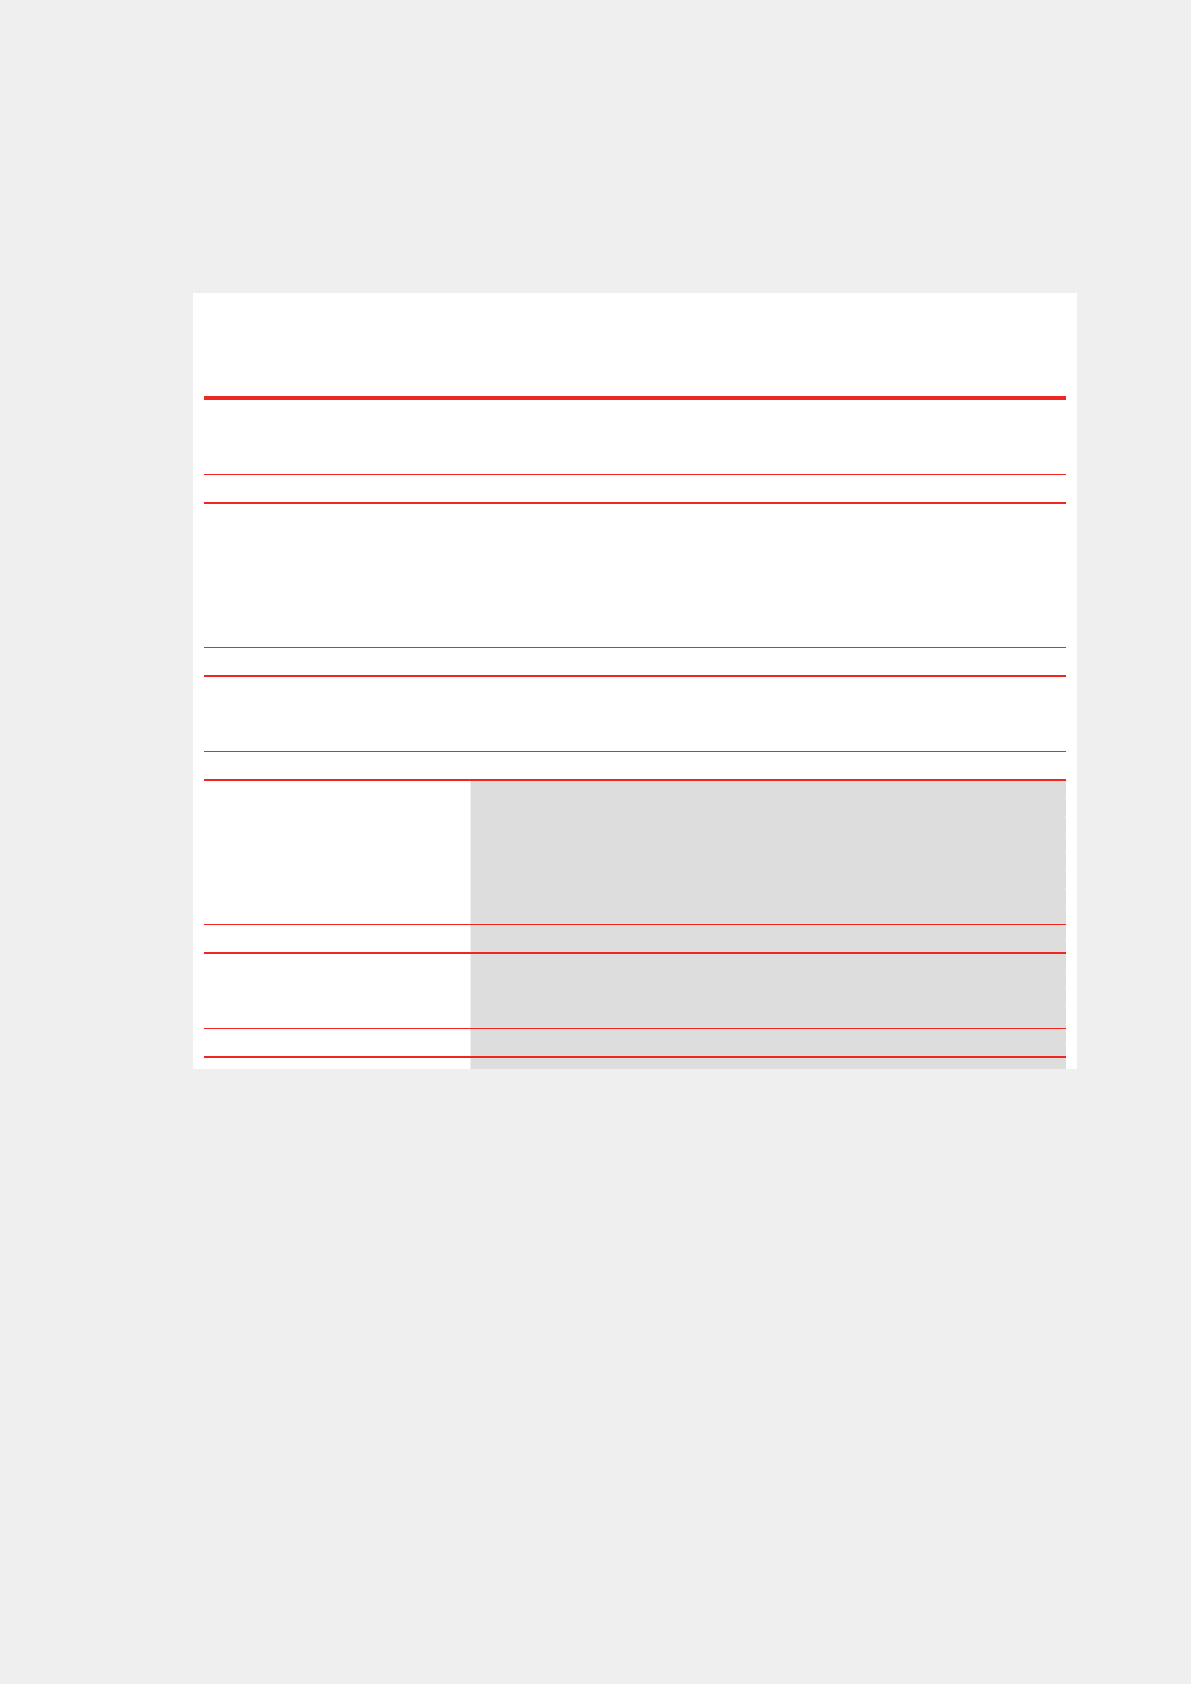
2011/12 Annual Report Lenovo Group Limited 143
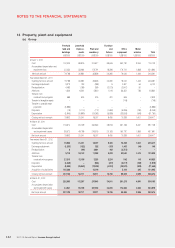
14 Property, plant and equipment (continued)
(b) Company
Leasehold
improve-
ments
Furniture
and fixtures
Office
equipment
Motor
vehicles Total
US$’000 US$’000 US$’000 US$’000 US$’000
At April 1, 2010
Cost 2,335 184 828 248 3,595
Accumulated depreciation 1,835 114 617 223 2,789
Net book amount 500 70 211 25 806
Year ended March 31, 2011
Opening net book amount 500 70 211 25 806
Exchange adjustment (1) (10) 10 (1) (2)
Additions –57 93 –150
Disposals –(1) (1) (3) (5)
Depreciation (130) (37) (76) (17) (260)
Closing net book amount 369 79 237 4689
At March 31, 2011
Cost 2,329 192 592 158 3,271
Accumulated depreciation 1,960 113 355 154 2,582
Net book amount 369 79 237 4689
Year ended March 31, 2012
Opening net book amount 369 79 237 4689
Exchange adjustment 3 1 (1) – 3
Additions 410 24 111 322 867
Disposals – – (2) (4) (6)
Depreciation (152) (45) (81) (51) (329)
Closing net book amount 630 59 264 271 1,224
At March 31, 2012
Cost 1,383 175 628 322 2,508
Accumulated depreciation 753 116 364 51 1,284
Net book amount 630 59 264 271 1,224