Lenovo 2012 Annual Report Download - page 111
Download and view the complete annual report
Please find page 111 of the 2012 Lenovo annual report below. You can navigate through the pages in the report by either clicking on the pages listed below, or by using the keyword search tool below to find specific information within the annual report.-
 1
1 -
2
-
3
-
4
-
5
-
6
-
7
-
8
-
9
-
10
-
11
-
12
-
13
-
14
-
15
-
16
-
17
-
18
-
19
-
20
-
21
-
22
-
23
-
24
-
25
-
26
-
27
-
28
-
29
-
30
-
31
-
32
-
33
-
34
-
35
-
36
-
37
-
38
-
39
-
40
-
41
-
42
-
43
-
44
-
45
-
46
-
47
-
48
-
49
-
50
-
51
-
52
-
53
-
54
-
55
-
56
-
57
-
58
-
59
-
60
-
61
-
62
-
63
-
64
-
65
-
66
-
67
-
68
-
69
-
70
-
71
-
72
-
73
-
74
-
75
-
76
-
77
-
78
-
79
-
80
-
81
-
82
-
83
-
84
-
85
-
86
-
87
-
88
-
89
-
90
-
91
-
92
-
93
-
94
-
95
-
96
-
97
-
98
-
99
-
100
-
 101
101 -
 102
102 -
 103
103 -
 104
104 -
 105
105 -
 106
106 -
 107
107 -
 108
108 -
 109
109 -
 110
110 -
 111
111 -
 112
112 -
 113
113 -
 114
114 -
 115
115 -
 116
116 -
 117
117 -
 118
118 -
 119
119 -
 120
120 -
 121
121 -
122
-
123
-
124
-
125
-
126
-
127
-
128
-
129
-
130
-
131
-
132
-
133
-
134
-
135
-
136
-
137
-
138
-
139
-
140
-
141
-
142
-
143
-
144
-
145
-
146
-
147
-
148
-
149
-
150
-
151
-
152
-
153
-
154
-
155
-
156
-
157
-
158
-
159
-
160
-
161
-
162
-
163
-
164
-
165
-
166
-
167
-
168
-
169
-
170
-
171
-
172
-
173
-
174
-
175
-
176
-
177
-
178
-
179
-
180
 |
 |
2011/12 Annual Report Lenovo Group Limited 109
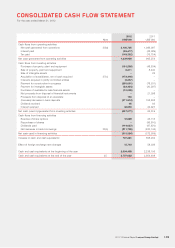
CONSOLIDATED CASH FLOW STATEMENT
For the year ended March 31, 2012
2012 2011
Note US$’000 US$’000
Cash flows from operating activities
Net cash generated from operations 35(a) 2,126,765 1,089,097
Interest paid (38,477) (48,089)
Tax paid (148,332) (75,754)
Net cash generated from operating activities 1,939,956 965,254
Cash flows from investing activities
Purchase of property, plant and equipment (101,238) (48,834)
Sale of property, plant and equipment 6,311 8,440
Sale of intangible assets –25
Acquisition of subsidiaries, net of cash acquired 37(c) (172,316) –
Interests acquired in jointly controlled entities (3,237) –
Payment for construction-in-progress (205,601) (78,531)
Payment for intangible assets (22,354) (20,297)
Purchase of available-for-sale financial assets (10,055) –
Net proceeds from disposal of financial instruments –21,398
Proceeds from disposal of an associate 145 –
(Increase)/decrease in bank deposits (371,514) 158,298
Dividend received 95 93
Interest received 42,693 24,927
Net cash (used in)/generated from investing activities (837,071) 65,519
Cash flows from financing activities
Exercise of share options 10,889 25,116
Repurchase of shares –(86,610)
Dividends paid (114,687) (87,870)
Net decrease in bank borrowings 35(b) (211,726) (223,145)
Net cash used in financing activities (315,524) (372,509)
Increase in cash and cash equivalents 787,361 658,264
Effect of foreign exchange rate changes 15,793 58,039
Cash and cash equivalents at the beginning of the year 2,954,498 2,238,195
Cash and cash equivalents at the end of the year 25 3,757,652 2,954,498