Lenovo 2012 Annual Report Download - page 110
Download and view the complete annual report
Please find page 110 of the 2012 Lenovo annual report below. You can navigate through the pages in the report by either clicking on the pages listed below, or by using the keyword search tool below to find specific information within the annual report.-
 1
1 -
2
-
3
-
4
-
5
-
6
-
7
-
8
-
9
-
10
-
11
-
12
-
13
-
14
-
15
-
16
-
17
-
18
-
19
-
20
-
21
-
22
-
23
-
24
-
25
-
26
-
27
-
28
-
29
-
30
-
31
-
32
-
33
-
34
-
35
-
36
-
37
-
38
-
39
-
40
-
41
-
42
-
43
-
44
-
45
-
46
-
47
-
48
-
49
-
50
-
51
-
52
-
53
-
54
-
55
-
56
-
57
-
58
-
59
-
60
-
61
-
62
-
63
-
64
-
65
-
66
-
67
-
68
-
69
-
70
-
71
-
72
-
73
-
74
-
75
-
76
-
77
-
78
-
79
-
80
-
81
-
82
-
83
-
84
-
85
-
86
-
87
-
88
-
89
-
90
-
91
-
92
-
93
-
94
-
95
-
96
-
97
-
98
-
99
-
 100
100 -
 101
101 -
 102
102 -
 103
103 -
 104
104 -
 105
105 -
 106
106 -
 107
107 -
 108
108 -
 109
109 -
 110
110 -
 111
111 -
 112
112 -
 113
113 -
 114
114 -
 115
115 -
 116
116 -
 117
117 -
 118
118 -
 119
119 -
 120
120 -
121
-
122
-
123
-
124
-
125
-
126
-
127
-
128
-
129
-
130
-
131
-
132
-
133
-
134
-
135
-
136
-
137
-
138
-
139
-
140
-
141
-
142
-
143
-
144
-
145
-
146
-
147
-
148
-
149
-
150
-
151
-
152
-
153
-
154
-
155
-
156
-
157
-
158
-
159
-
160
-
161
-
162
-
163
-
164
-
165
-
166
-
167
-
168
-
169
-
170
-
171
-
172
-
173
-
174
-
175
-
176
-
177
-
178
-
179
-
180
 |
 |

2011/12 Annual Report Lenovo Group Limited
108
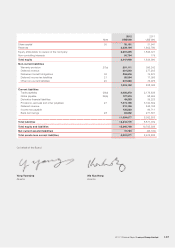
BALANCE SHEET
At March 31, 2012
2012 2011
Note US$’000 US$’000
Non-current assets
Property, plant and equipment 14 1,224 689
Construction-in-progress 16 4,607 3,602
Intangible assets 17 45,802 24,771
Investments in subsidiaries 18(a) 2,472,880 1,929,073
2,524,513 1,958,135
Current assets
Derivative financial assets 953 –
Deposits, prepayments and other receivables 24(c) 5,928 1,626
Amounts due from subsidiaries 18(b) 777,818 692,351
Bank deposits 25 –20,000
Cash and cash equivalents 25 37,124 25,955
821,823 739,932
Total assets 3,346,336 2,698,067
Share capital 30 33,131 31,941
Reserves 31 1,919,483 1,871,739
Total equity 1,952,614 1,903,680
Non-current liabilities
Other non-current liabilities 29 256,818 –
Current liabilities
Derivative financial liabilities 796 5,565
Provisions, accruals and other payables 27 31,637 39,319
Amounts due to subsidiaries 18(b) 1,104,471 549,503
Bank borrowings 28 –200,000
1,136,904 794,387
Total liabilities 1,393,722 794,387
Total equity and liabilities 3,346,336 2,698,067
Net current liabilities 315,081 54,455
Total assets less current liabilities 2,209,432 1,903,680
On behalf of the Board
Yang Yuanqing Ma Xuezheng
Director Director